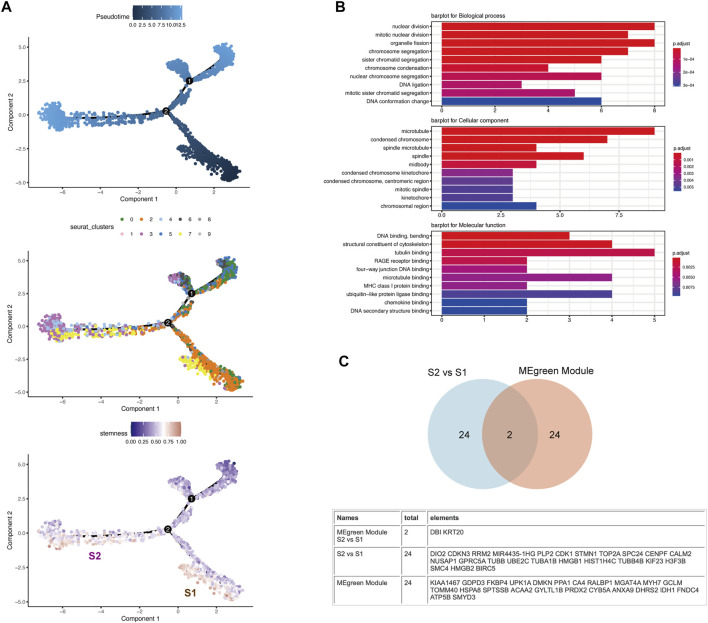
FIGURE 5.
Pseudotime analysis revealed the heterogeneity of CSCs along their developmental trajectory (A) The distribution of pseudotime (top), cluster (middle) and stemness score (bottom) exhibits a continuous pattern. Top: Pseudotime is shown colored along a gradient from dark to light blue, and the start of pseudotime is indicated. Middle: Clusters are color-coded by subpopulation. Bottom: CSCs are divided into two subsets (S1 and S2) along their developmental trajectory (B) The figure shows that the differentially expressed genes with higher expression in S2 than S1 were extracted and screened for GO analysis. The results of the GO analysis suggests that the S2 subgroup shows higher division and proliferation abilities than the S1 subgroup (C) Venn diagram depicting the intersection between the DEGs of S2 vs. S1 and the gene set corresponding to the MEgreen module in WGCNA.

