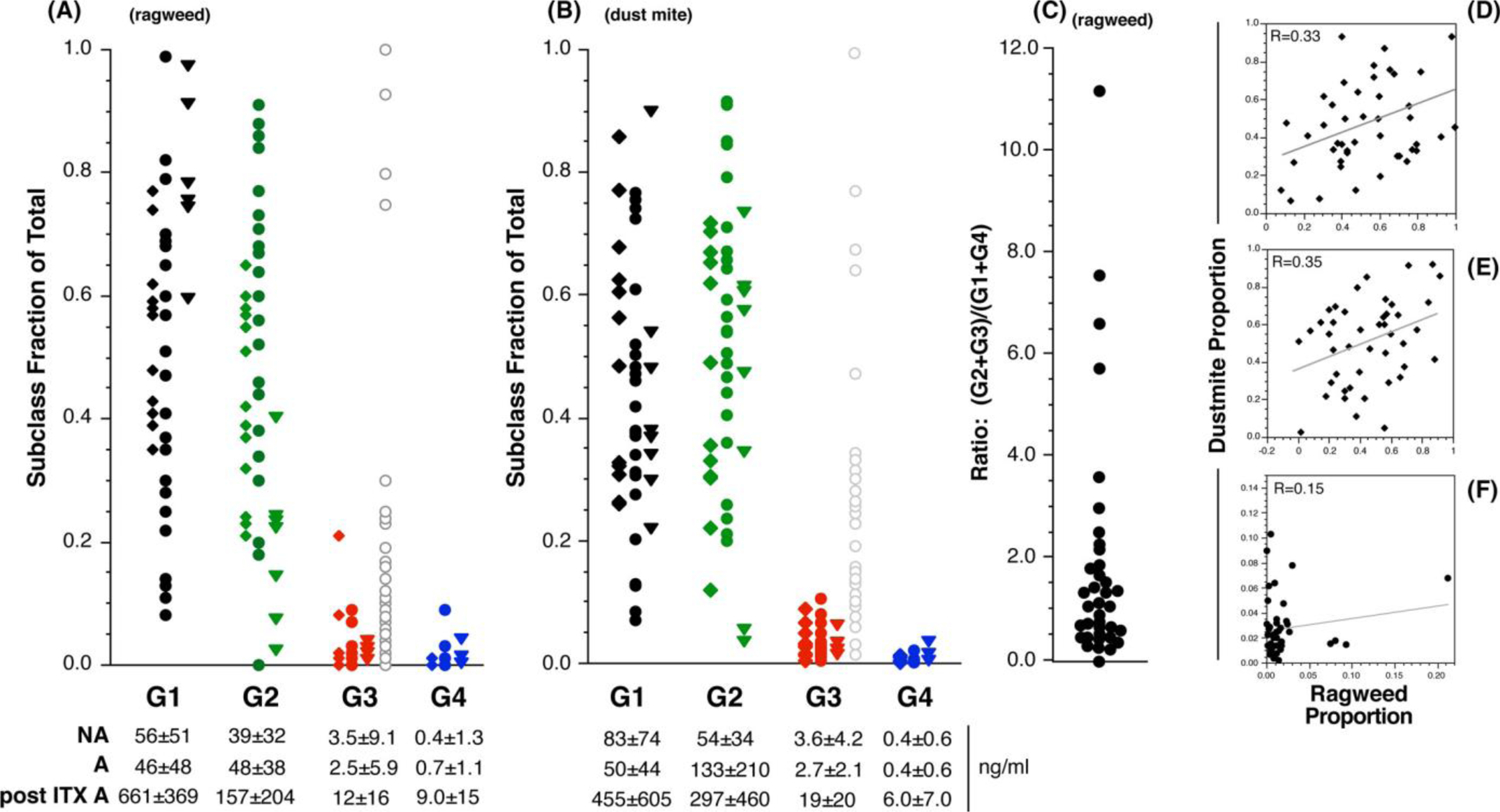
FIGURE 1.

Subclasses of allergen-specific IgG: Serum IgG2 and IgG3 levels are not predicted by IgG1/IgG4 levels
Subclass proportion—population distribution. Panel A; proportions of IgG1, IgG2, IgG3 and IgG4 in atopic and non-atopic subjects for ragweed-specific IgG. The diamond symbols represent non-atopic subjects, the circle symbols represent atopic subjects and the triangle symbols represent atopic subjects with a reported history of AIT. For the IgG3 data set, a fourth column (represented by the grey open circle symbols), the proportion data were transformed by multiplying by 10 to account the higher functional effect of IgG3. Absolute average ragweed- or dust mite-specific subclass concentrations (± S.D.) are shown below the x-axis where A = allergic, NA = non-allergic and post ITX A = allergics with a reported history of AIT. Panel B shows subclass proportion distributions for dust mite-specific IgG in the three categories of subjects. Panel C; Distribution of the ratio of ragweed-specific (IgG2+IgG3)/(IgG1+IgG4) for the non-atopic and AIT-naïve atopics. Panels D-F show the correlation between ragweed- vs. dust mite-specific IgG1, 2 and 3 proportions, respectively; R = .331, p = .028; R = .353, p = .019; R = .151, p = .312, respectively
