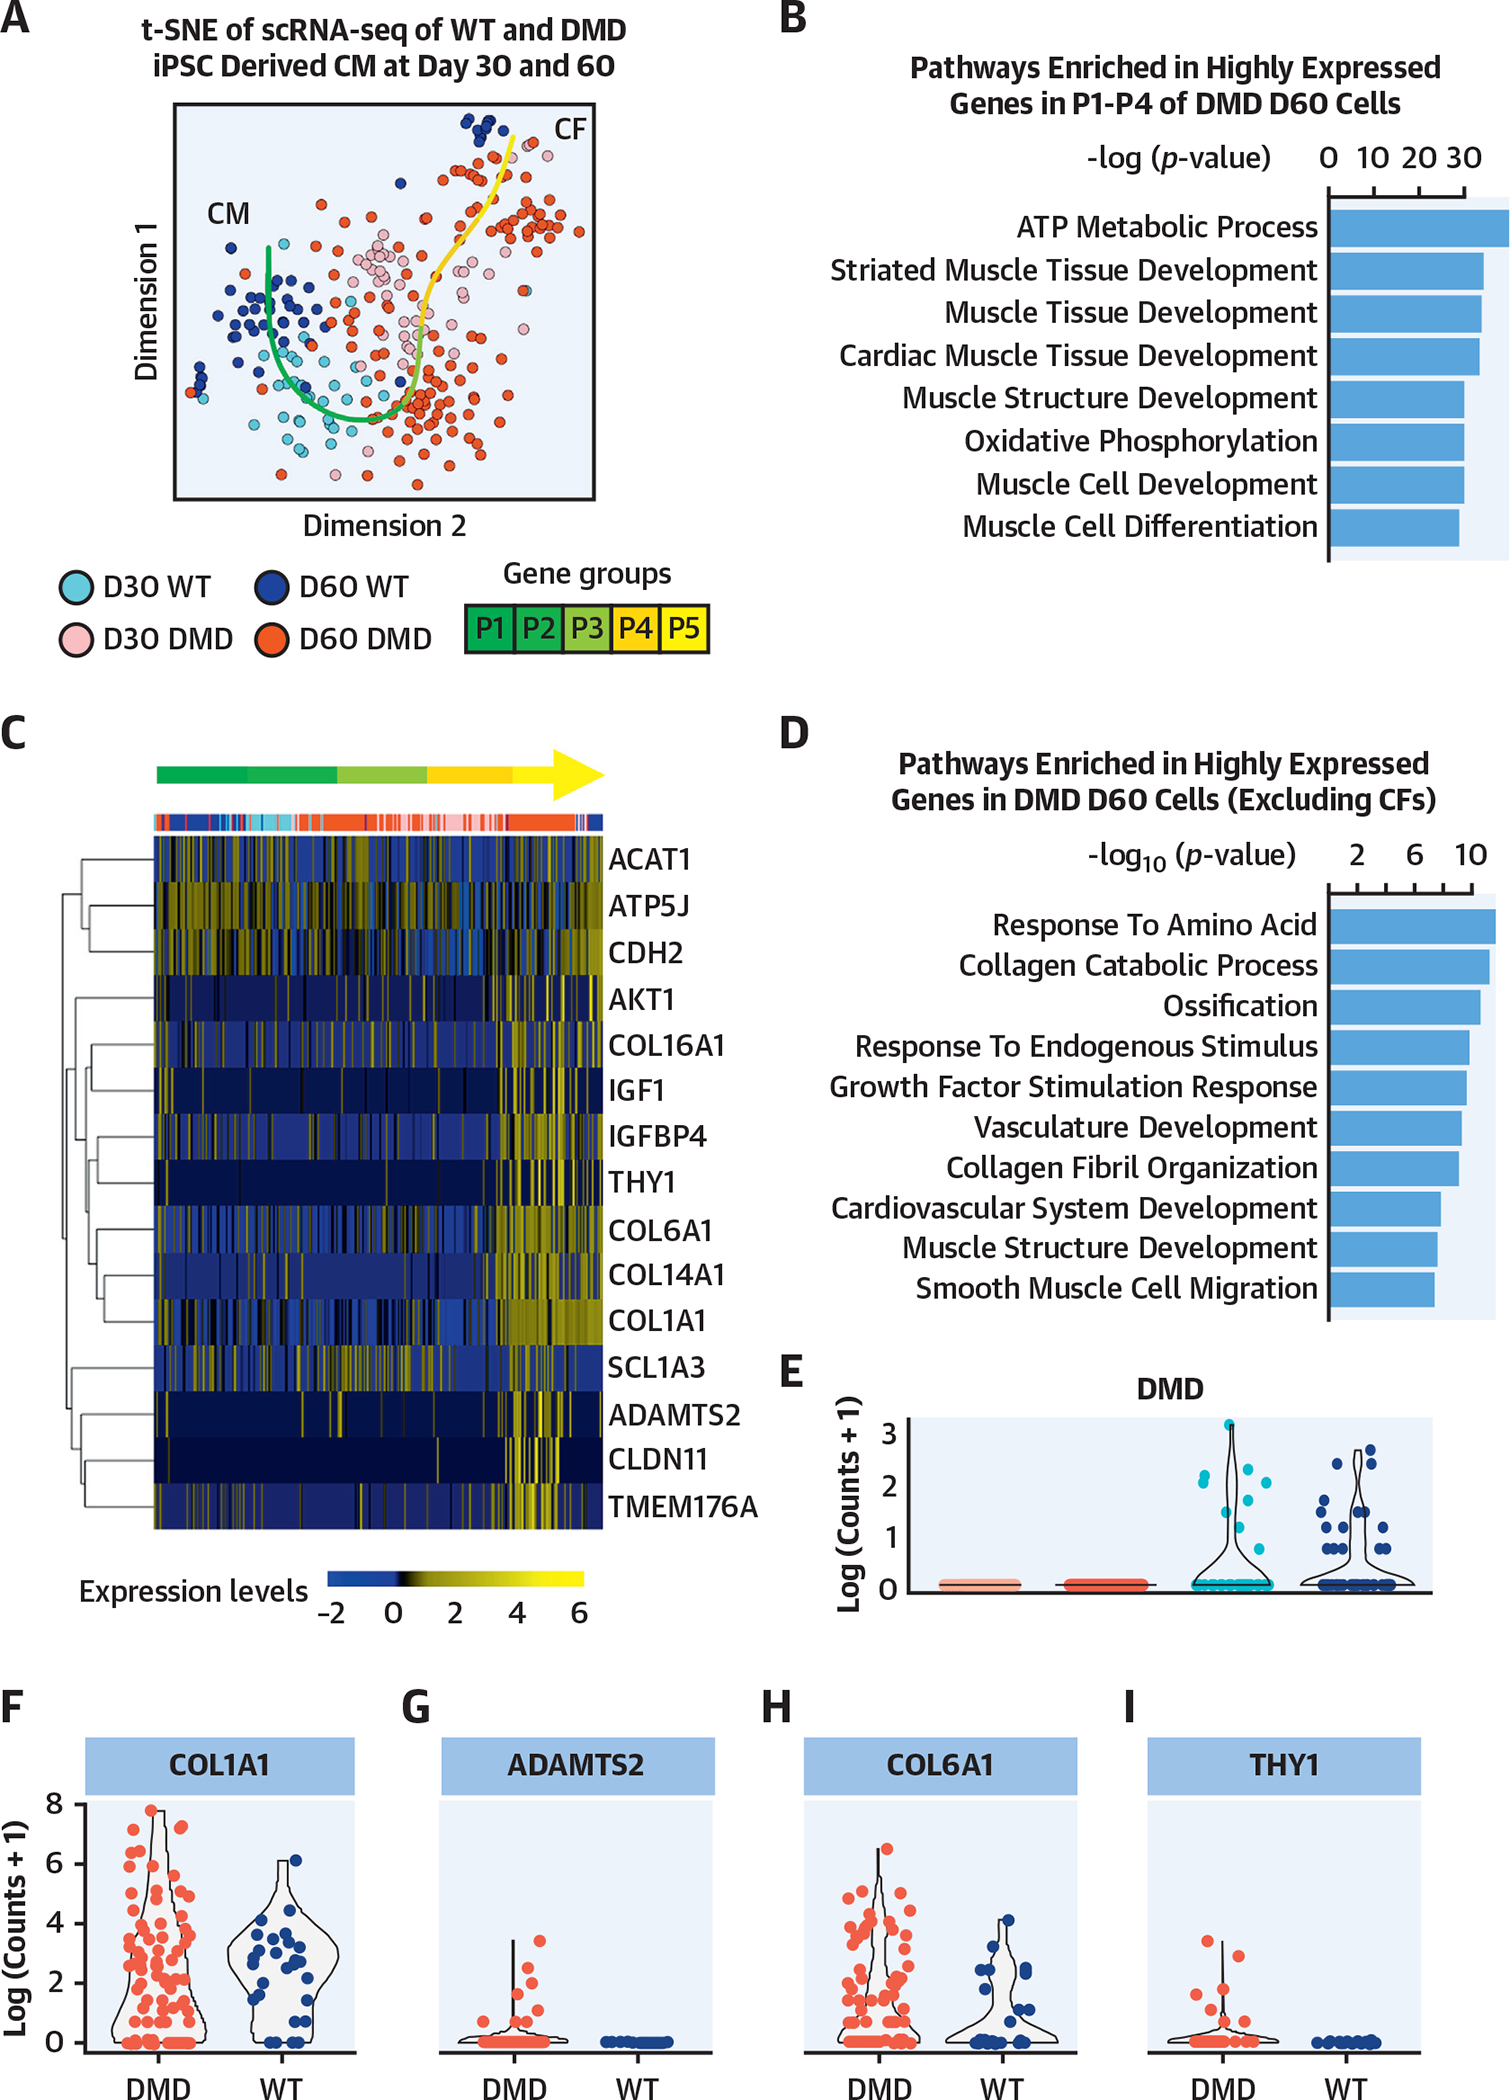
FIGURE 3. Single-Cell Genomics of Isogenic DMD hiPSC-Derived CMs.

(A) The small conditional RNA-seq data matrix is normalized and treated for batch effects using ComBat (Surrogate Variable Analysis R package, JHU Bloomberg School of Public Health, Baltimore, Maryland). The t-SNE plot shows the clustering of the resulting matrix and indicates grouping of CMs and CFs. The dark red points represent DMD cells at day 60 (n = 151), pink points represent DMD cells at day 30 (n = 52), dark blue points represent WT cells at day 60 (n = 54), and light blue points represent WT cells at day 30 (n = 41). Using R package princurve (AT&T Bell Laboratories, Murray Hill, New Jersey), a principal curve is fit to the t-SNE data matrix, and the curve is split into 5 segments, shown in the green gradient labeled P1 to P5. (B) Highly expressed gene groups within each segment determined pathways enriched in segments P1 to P4. These segments indicate the subset of cells that are cardiomyocytes. According to the top 8 hits shown in the bar plot of the ToppGene pathway analysis (Cincinnati Children’s Hospital Medical Center, Cincinnati, Ohio), based on −log(p value), the genes highly expressed in P1 to P4 are linked to cardiac function. (C) The heatmap highlights genes that are related to fibrosis, calcium-channel transportation issues, and GPCR signaling and metabolism. Expression is calculated by getting log-transformed, normalized counts of the reads mapped to the gene. Columns are in the same order as principal curve segments P1 to P5, indicated by the same green gradient color as in A. (D) The pathway analysis indicated the biological processes enriched in highly expressed genes in DMD day 60 cells, after excluding the 62 CDH11-expressing CF cells. (E) The violin plot shows the log-transformed, normalized expression of the reads mapped to the deleted DMD sequence. The day 30 and day 60 DMD cells do not show the presence of this sequence, confirming that the DMD sequence is present only in the WT cells. (F to I) The violin plots show the log-transformed, normalized expression of genes related to fibrosis and indicate that there is higher representation of these genes in the DMD day 60 samples compared with WT day 60. CF = cardiofibroblast; GPCR = G protein-coupled receptor; t-SNE = t-stochastic neighbor embedding; WT = wild type; other abbreviations as in Figure 1.
