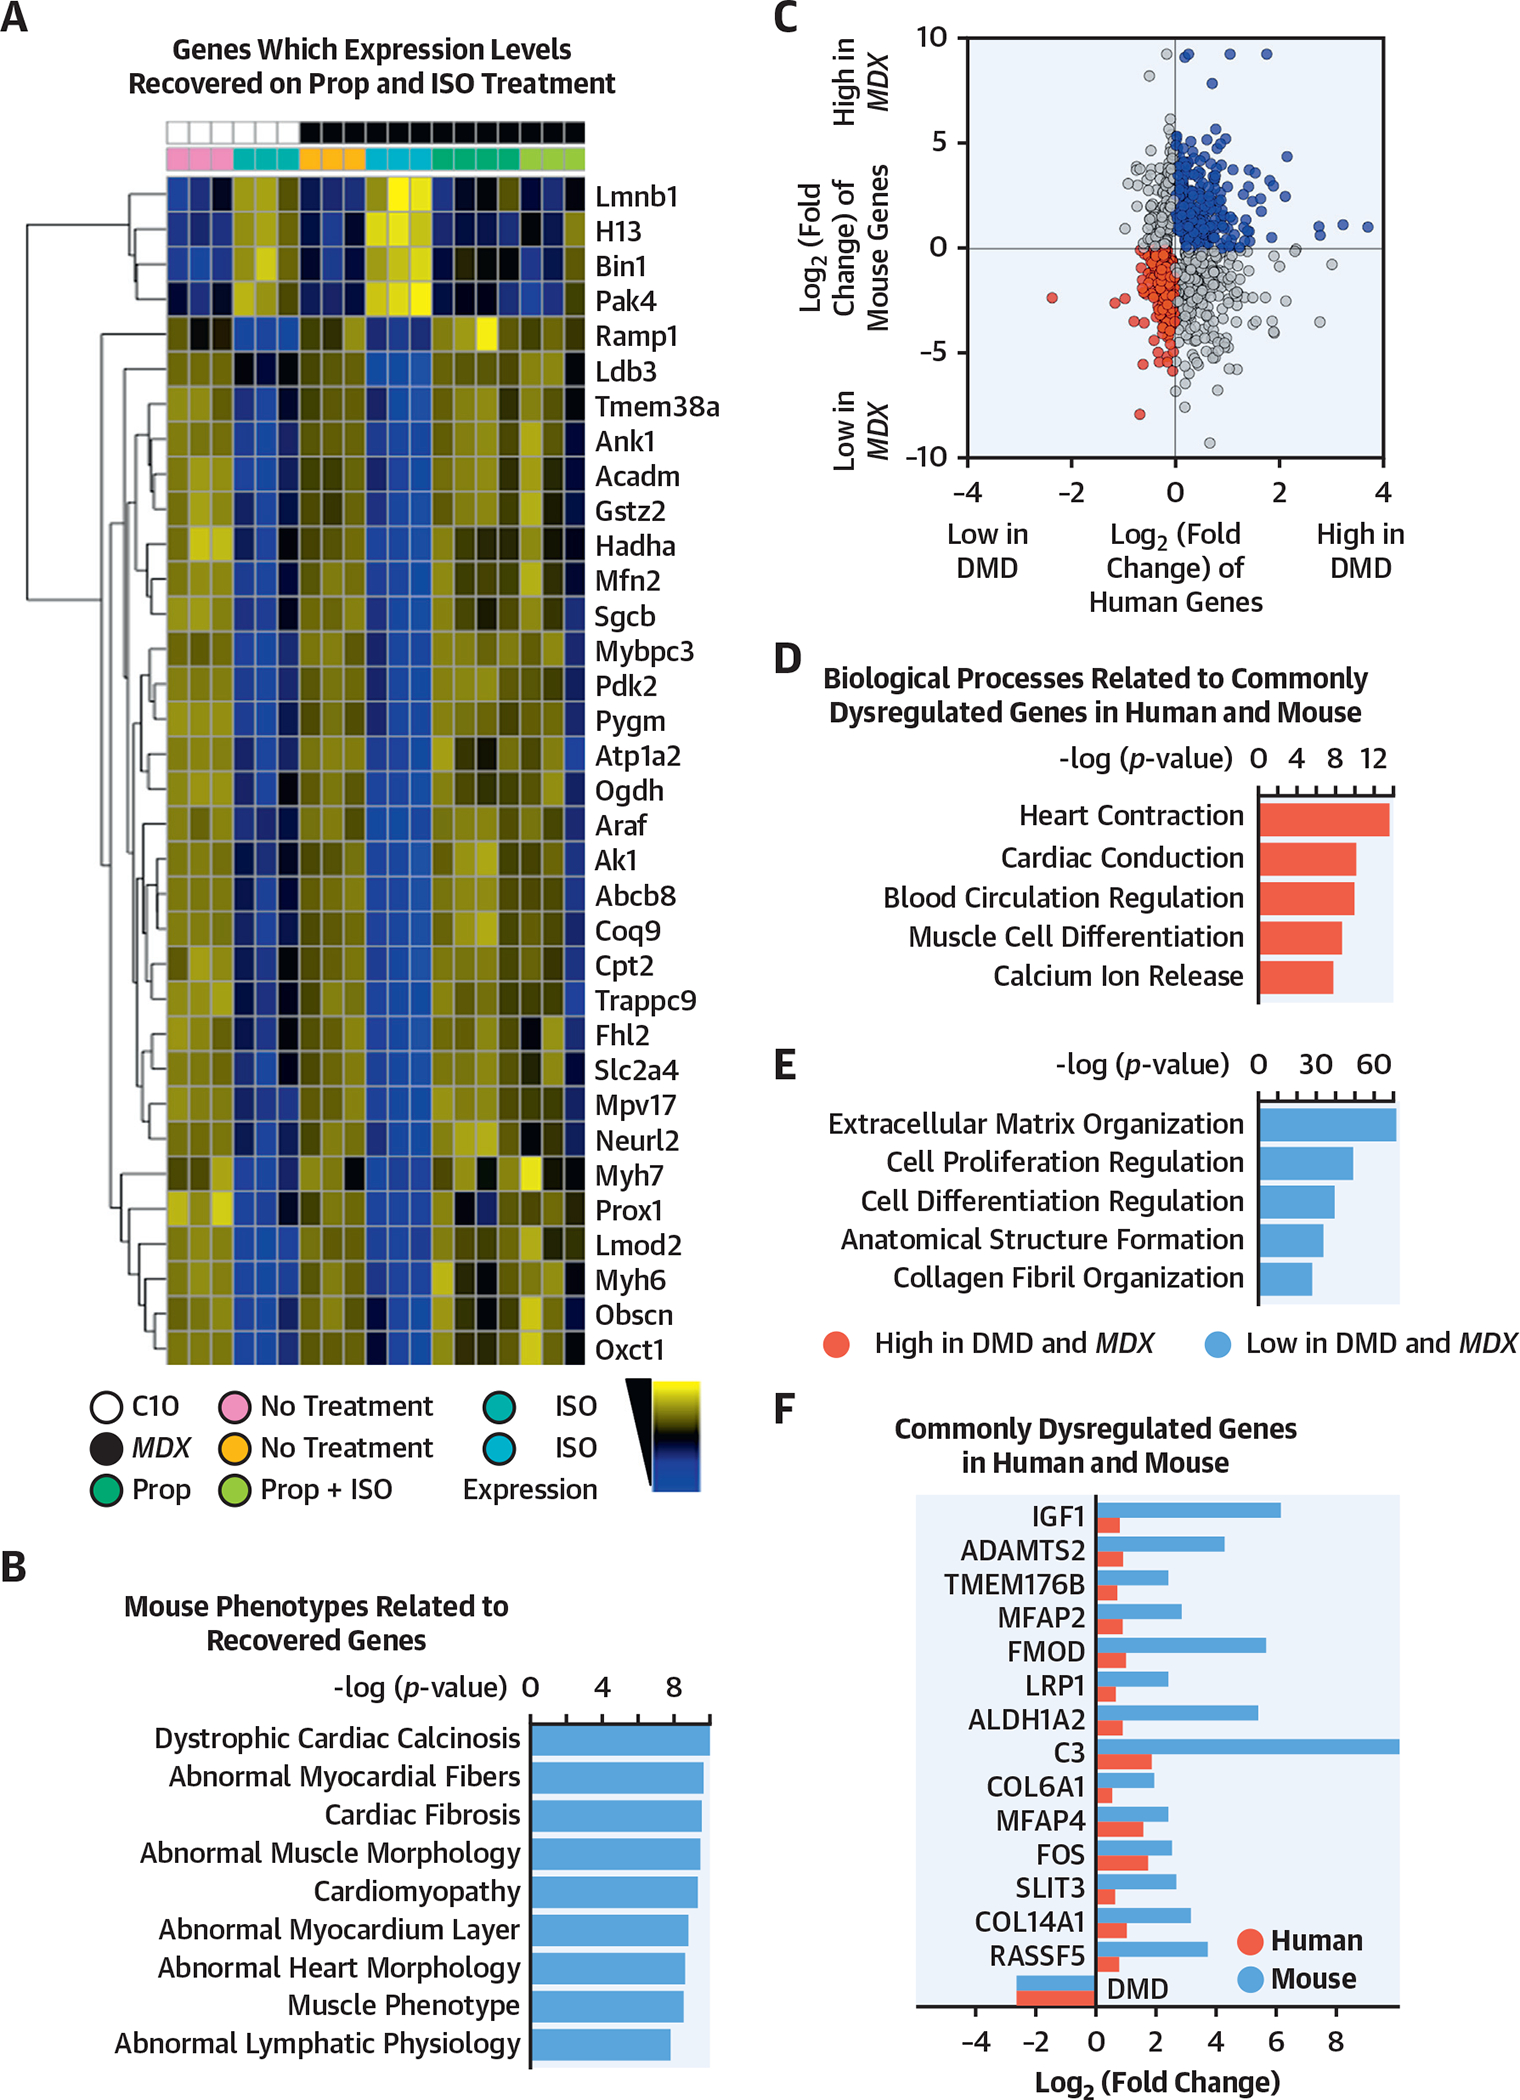
FIGURE 5. The mdx Mouse Hearts and Human DMD iPSC-Derived CMs Showed Similar Dysregulated Biological Processes.

(A) The heatmap shows log transformed, normalized counts of the reads mapped to the genes, where the color blue indicates low expression, and the color yellow indicates high expression. The heatmap indicates a subset of all the transcripts dysregulated in the respective mouse models with or without treatment (mdx: all male animals; mean age: 5.3 months; range: 3.4 to 5.6 months; control: all male animals; mean age: 5.3 months; range: 3.3 to 5.6 months). Transcripts were gathered from (B) ToppGene pathway analysis of the transcripts that fit these criteria, ordered by their −log(p value). (C) Merged data from mouse and human samples. After differential expression analysis with DESeq2, differentially expressed transcripts (p < 0.05) were plotted based on fold change. Upregulated (blue) and downregulated (red) transcripts in DMD conditions were used as queries for pathway analysis in ToppGene. (D, E) The bar plots showed the ToppGene results of the biological processes that were related to commonly dysregulated genes in human and mouse, ordered by −log(p value). (F) Transcripts involved in the 5 biological processes of upregulated and downregulated genes were shown. These genes were commonly dysregulated in human (black) and mouse (gray). C10 = control mouse model; mdx mouse = dystrophin-knockout mouse model; other abbreviations as in Figures 1 and 4.
