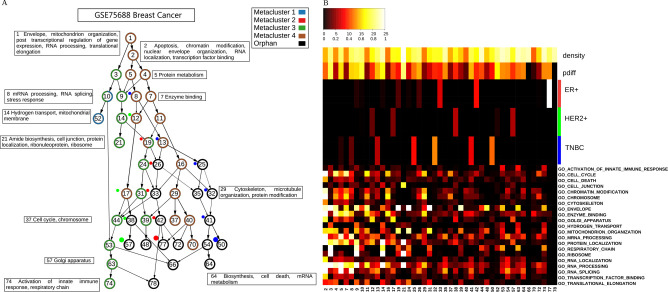
Fig. 2.
Summary information of clustering results of GSE75688 breast cancer data. The left hierarchy (A) displays the reduced hierarchy derived from stable k-means clusters. A node denotes a gene cluster. An edge denotes an inheritance relation from a higher-level cluster (a cluster generated by a larger k) to a lower-level cluster (a cluster generated by a smaller k). The thickness of an edge reflects the overlap level (intersection size over the higher-level cluster size). Uniquely enriched selected GO terms of clusters are annotated in boxes. The meta gene cluster identities of gene clusters are annotated by the circumference colors of nodes. Some gene clusters belong to multiple meta gene clusters, and the orphan clusters without meta gene cluster assignments are colored by black. The colored dots along some lineages denote significant enrichment of marker gene sets reported in the study (ER+, HER+ and TNBC genes in breast cancer data) in gene clusters of the reduced hierarchy. The right heatmap (B) displays (1) densities of valid entries of gene clusters, (2) homogeneity pdiff scores of gene clusters (range in [0, 1]), (3) − log10 of hyper-geometric enrichment P-values of the previously reported marker genes in gene clusters (ER+, HER2+, TNBC, range in [0, 25], colors compatible with the colored dots in the left panel), (4) − log10 of FDR-adjusted hyper-geometric enrichment P-values of selected GO terms appeared in the left boxes in gene clusters (range in [0, 25]). The color scales of − log10 P-values (between 0 and 25) and density and pdiff (between 0 and 1) are displayed at the top of B.

