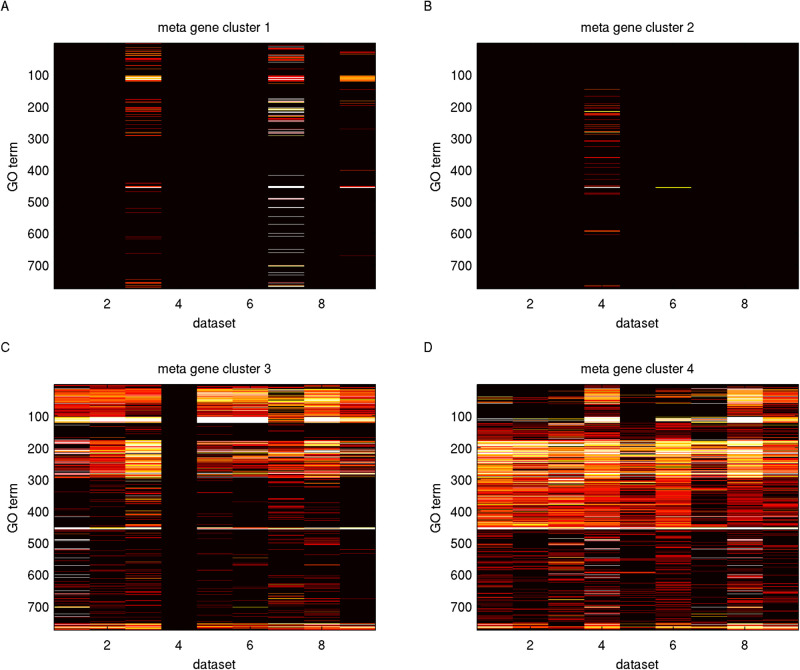
Fig. 3.
GO term enrichment of meta gene clusters deduced from gene clusters. Each panel displays the enrichment outcomes of one meta gene cluster over selected GO terms. The selected and sorted GO terms for meta gene clusters are identical for all panels and are reported in Table S12. In each panel, an entry visualizes the geometric mean of − log10 of FDR-adjusted P-values of a GO term (row) over the member clusters in a dataset (column).

