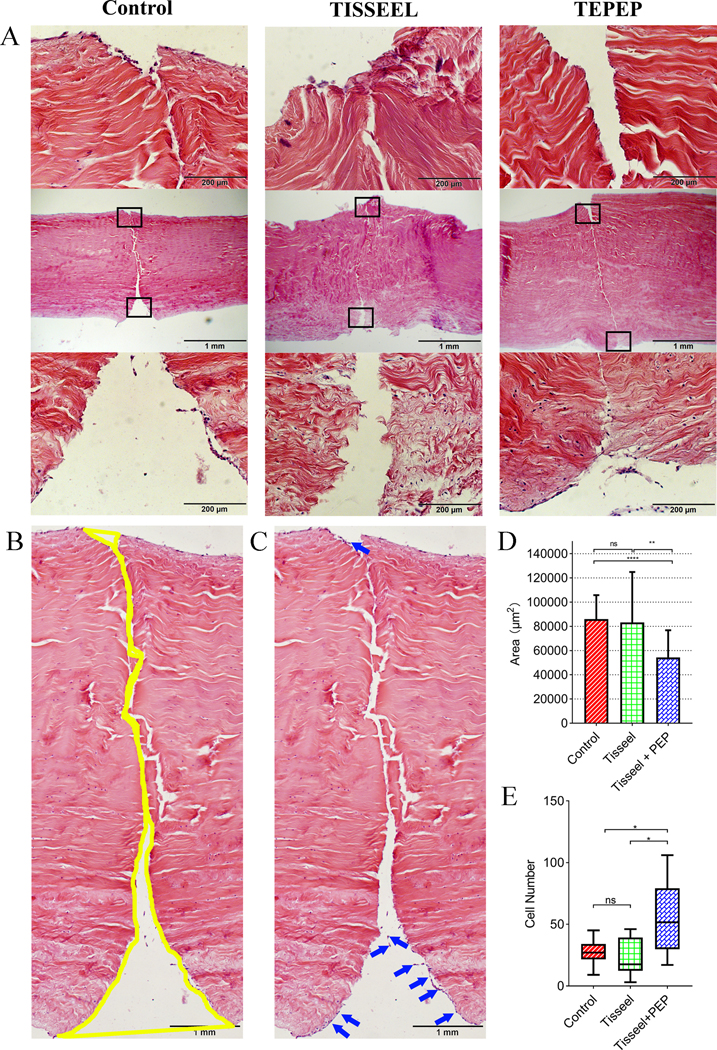
Figure 4:
Histology results of healing tendons in treatment groups at 4 weeks. A: Representative H&E-stained images. B-C: Representative H&E-stained images from control group. Yellow area showed the healing gap of tendons. Blue arrows showed the fibroblasts migrate to the surface of injury tendon. (Scale bar: 1 mm) D. Quantification of healing among three groups. E. Quantification of the number of fibroblasts among three groups. (*p < 0.05, **p < 0.01, ***p < 0.001, ****p < 0.0001)

