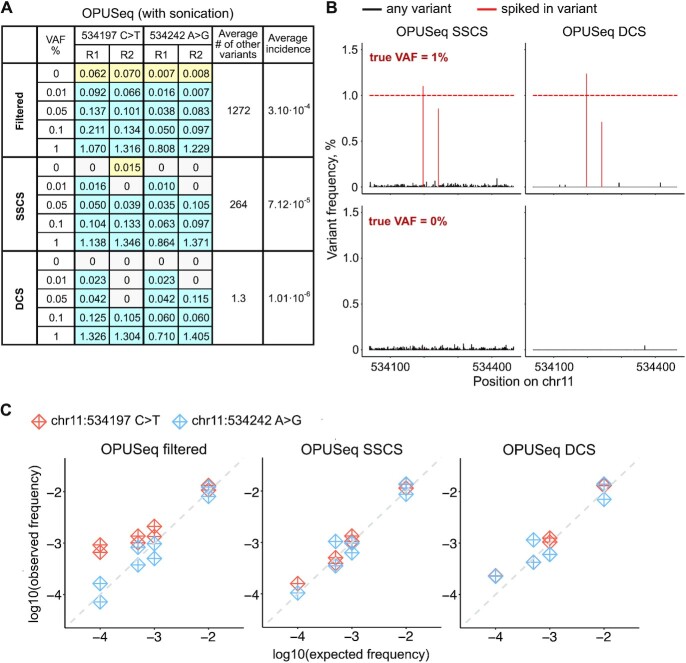
Figure 5.
OPUSeq coupled with a sonication-based protocol shows better performance in error removal. (A) Summary table with results obtained from OPUSeq with sonication. Each colored-in cell shows the observed VAF (in %) of the specified spiked-in variant in each sample (for expected VAF of 0–1% and replicates 1 and 2). Blue: variants that were expected and detected. Yellow: variants that were erroneously detected in 0% VAF samples, where they should not be present. For each method of analysis (filtered reads, SSCS and DCS), the table shows the average number across all 10 samples of all unexpected (‘other’) detected variants. The last column shows the average unexpected variant incidence per method. (B) Plots as in Figure 3B, but for OPUSeq with sonication (samples shown are from replicate 1). (C) Log10-transformed observed versus expected VAFs of the spiked-in variants.

