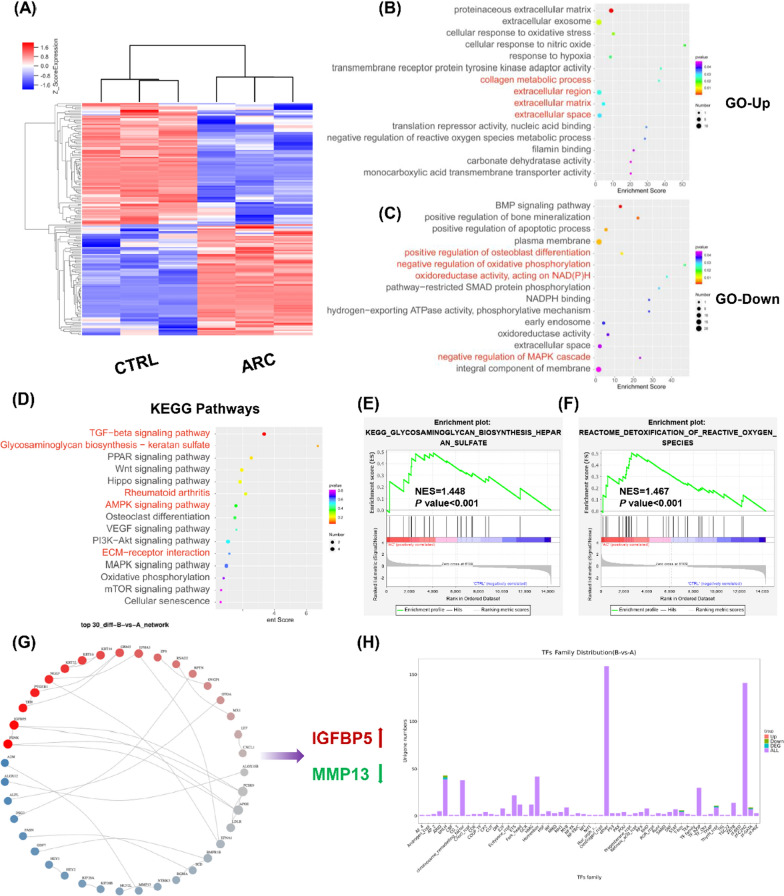
Fig. 5.
RNA sequencing analysis between CTRL and arctiin-treated chondrocytes. A The heat map showed the differentially expressed genes (DEGs) between CTRL and ARC groups (n = 3). B, C GO enrichment analysis indicated the up-regulated or down-regulated biological processes according to the DEGs. D KEGG enrichment analysis revealed the up-regulated or down-regulated pathways. E, F GSEA enrichment analysis identified the potential KEGG or Reactome pathways. G Proteins and proteins interaction (PPI) based on the DEGs. H Transcriptional factors (TFs) distribution analysis between CTRL and arctiin-treated group

