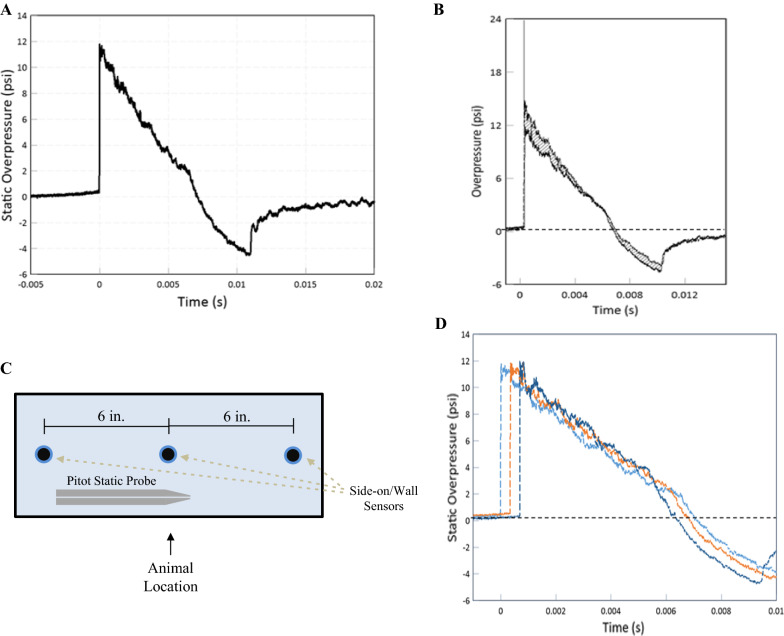
Fig. 1.
Blast wave characteristics of the McMillan Blast Device. A Representative overpressure curve with respect to time measured by a side-on piezoresistive sensor. B Overlay of overpressure waves from a face-on sensor of a pitot static probe and a side-on sensor coincident at the same location. Shaded areas represent dynamic overpressure impulses as a relatively minor component of the blast wave. C Two-dimensional representation of sensor location along the driven portion of the MBD where the animals are located during blast exposure. D Static overpressure traces from the side-on/wall sensors show spatial blast dynamics inside the tube near the animal location

