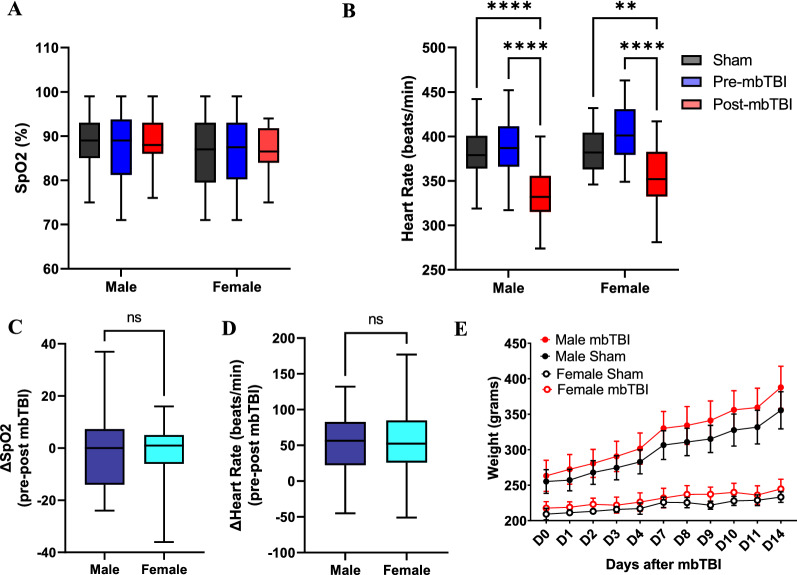
Fig. 2.
The effect of mbTBI on key physiological parameters in male and female rats. Physiological recordings were taken five minutes before (pre-mbTBI) and five minutes after (post-mbTBI) mbTBI procedure. A Box-and-whisker plot represents the peripheral oxyhemoglobin saturation (SpO2) and B Heart rate (sham, pre-mbTBI and post-mbTBI groups) from male and female rats (n = 28–45/group). C Box-and-whisker plot represents the change in SpO2 and D Heart rate (pre-mbTBI – post-mbTBI) from male and female rats (n = 28–45/group). E Daily weight measurement from 0 to 14 d post-mbTBI from male and female rats (n = 6/group). Data are Mean ± Max and Min (Box & Whisker) (A, B, C, D) or Mean ± SD (E). P ≤ 0.002 **, P ≤ 0.001 **** by Two-way ANOVA with Tukey’s post-hoc (A, B, E); ns (non-significant) by two-tailed, unpaired t-test (C, D)

