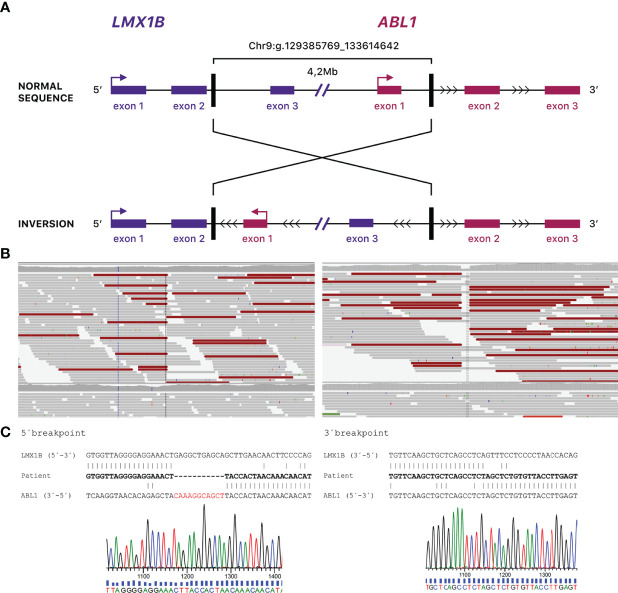
Figure 2.
(A) Schematic depiction of the inverted region. Vertical lines show the breakpoints. Note that the figure is not drawn to scale. (B) Whole genome sequencing data of the breakpoints of the inversion. (C) Schematic presentation of the breakpoint junction between intron 2 in LMX1B and intron 1 in ABL1 and sequence traces over the breakpoint junctions.

