Figure 3.

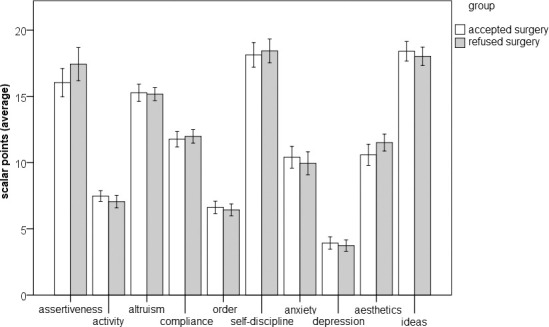
Comparison of facet traits within the broad Big Five personality domains between the group who accepted and the group who refused surgery. Columns represent averages, and whiskers show 95% CIs.

Comparison of facet traits within the broad Big Five personality domains between the group who accepted and the group who refused surgery. Columns represent averages, and whiskers show 95% CIs.