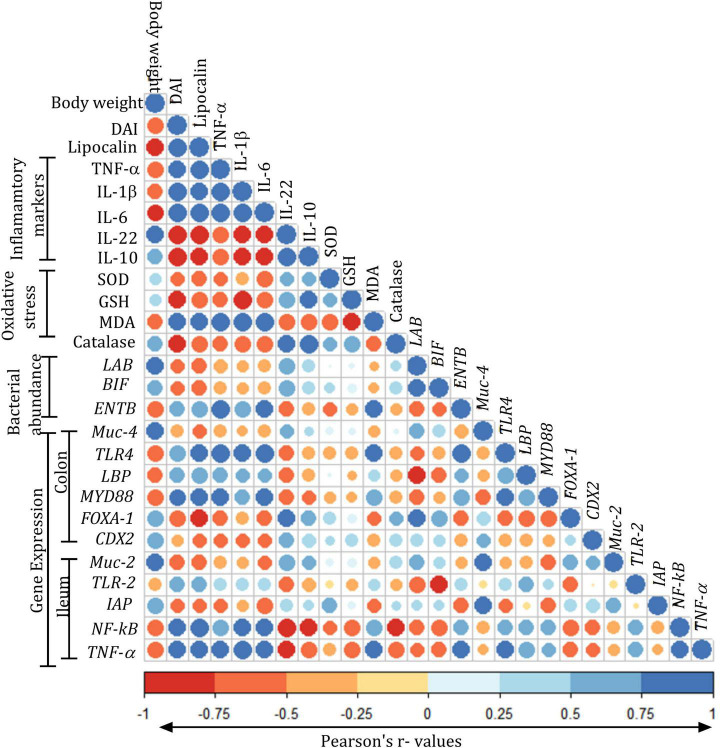
FIGURE 10.
Pearson’s correlation matrix of various parameters assessed in the study: Color gradients were given in terms of “r” values from Pearson’s correlation analysis for body weights (g); disease activity index (DAI); lipocalin (ng/ml); tumor necrosis factor-alpha (TNF-α, pg/ml); interleukin (IL)-1 β, IL-6, IL-22, and IL-10 (pg/ml); oxidative stress parameters: superoxide dismutase (SOD, U/mg protein), malondialdehyde (MDA, nM/mg protein), reduced glutathione (GSH, pM/mg protein), superoxide dismutase (SOD, U/mg protein), catalase (U/mg protein); expression of Lactobacillus (LAB), Bifidobacteria (BIF), Enterobacteriaceae (ENTB), muc gene (MUC-4), toll-like receptor-4 (TLR-4), LPS-binding protein (LBP), myeloid differentiation factor (MYD88), forkhead box protein (FOXA-1), caudal type homeobox 2 (CDX2) in the colon, expression of genes muc gene (MUC-2), toll-like receptor (TLR2), intestinal alkaline phosphatase (IAP), nuclear factor-κ beta (NF-kB), and tumor necrosis factor-alpha (TNF-α) in the ileum. All the values are expressed as mean.

