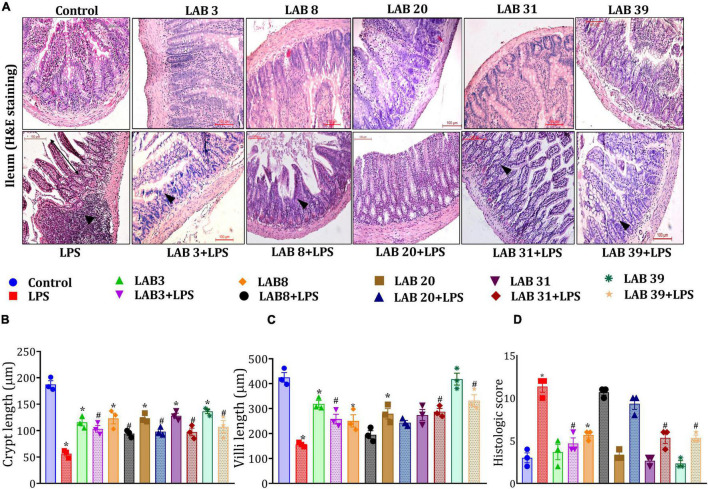
FIGURE 4.
Effect of LAB supplementation on the ileum architecture: (A) Hematoxylin–eosin staining images; (B) crypt length; (C) villi length; and (D) histologic score. Data were analyzed using one-way ANOVA with Tukey’s post hoc test (p ≤ 0.05). *Significant relative to control; #significant relative to the LPS group (N = 3); (arrows indicate the neutrophil infiltration; r: 200 μm, 200X).

