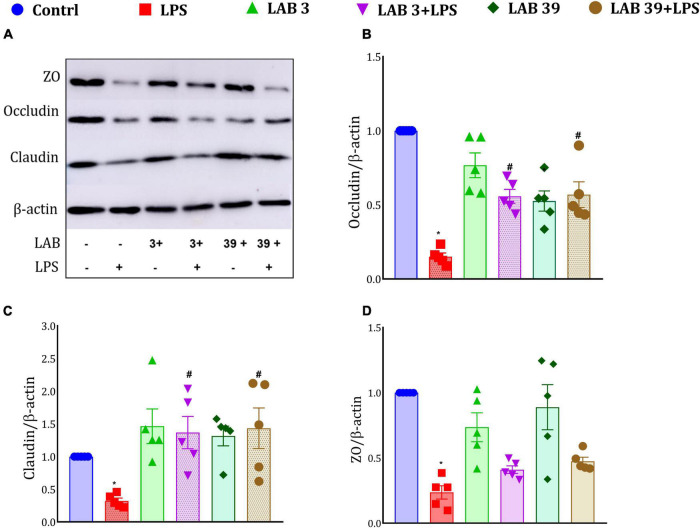
FIGURE 9.
Effect of LAB on the tight junction protein expression: (A) Representative Western blotting images; (B) expression of occludin relative to β-actin; (C) expression of claudin relative to β-actin; and (D) expression of zona occludin relative to β-actin. Data were analyzed using one-way ANOVA with Tukey’s post hoc test (p ≤ 0.05). *Significant relative to control; #significant relative to the LPS group (N = 5).

