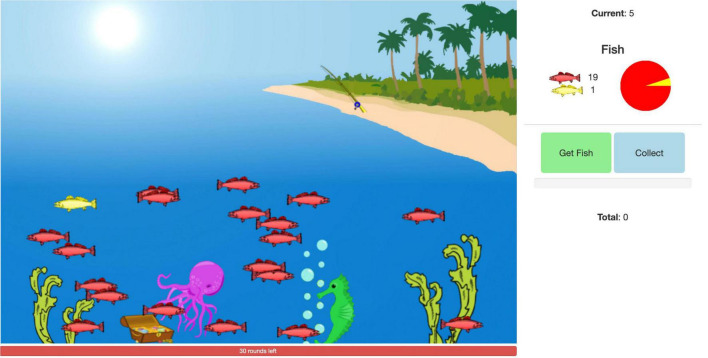
FIGURE 1.
A snapshot of a participant’s view of the task. The participant is asked on every trial to decide to collect the current points (“Collect” button) or go fishing for more points (“Get Fish” button). They can explicitly determine the risk based on three representations: the ratio of yellow to red fish in the pond, the ratio represented in digit form in the legend on the right, and the ratio in the pie chart on the right. Caught red fish earn the player five points. Caught yellow fish result in the subtraction of the current points at the top right.

