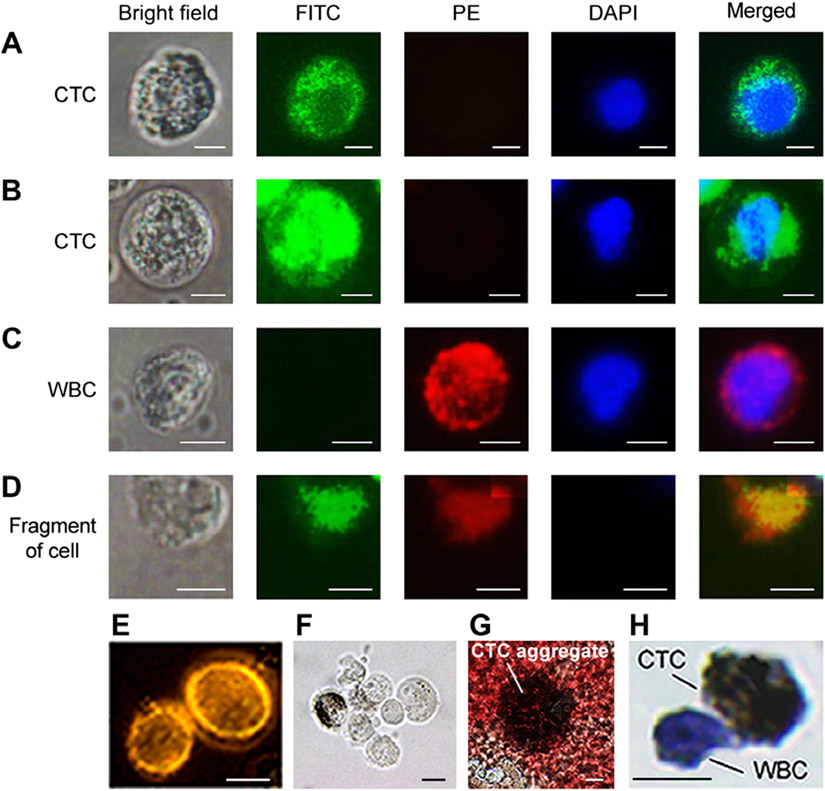
Fig. 4. Bright field and fluorescence images of cells from patient blood samples stained with dyes and targeted by antibodies.
(A and B) Nucleated (DAPI, blue) melanoma CTCs that express MCSP and CD146 receptors targeted by antibodies conjugated with FITC (green). A CTC with higher melanin content (A) exhibits lower fluorescence intensity compared to a CTC with lower melanin content (B). (C) A WBC that expresses the CD45 receptor, targeted by an antibody conjugated to PE dye (red). It does not have the MCSP and CD146 melanoma markers (no FITC fluorescence) and has a nucleus identified by DAPI (blue). (D) Debris that took up dyes nonspecifically and has no nucleus (no blue color). (E to G) Examples of CTC clusters consisting of two (E), seven (F) (bright field image), and many (≥20) CTCs, which are partly damaged and have released melanin (G). (H) An immunocytochemically stained single CTC (brown) with attached WBC (blue). Scale bars, 5 μm (A to D) and 10 μm (E to H).

