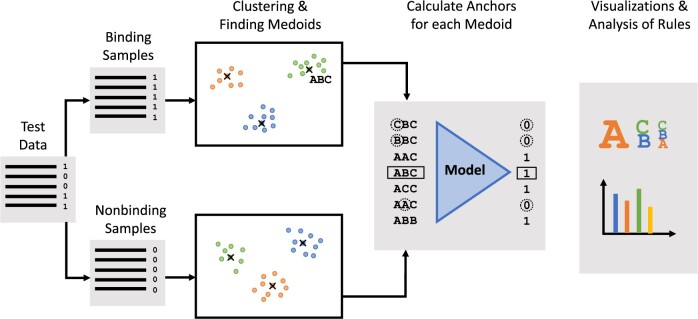
Fig. 1.
Overview of DECODE interpretability pipeline. The test data are split into binding and non-binding samples based on the predictions of the model. Both sets of samples are clustered and the medoid of each cluster is chosen as a representative example of the cluster. Note that the medoid is an actual sample from the cluster it represents. The pipeline allows for the use of different clustering algorithms, see Section 2.3. For each medoid, DECODE generates a set of rules using Anchors. Finally, the pipeline offers a range of visualizations and evaluation metrics for the final anchor rules

