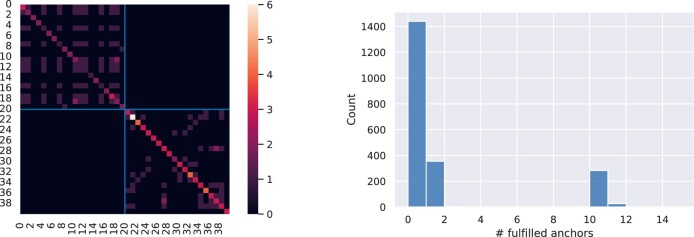
Fig. 5.
Anchors overlap and completeness analysis. Results are reported for the test set consisting of around 2k samples. Left plot shows the overlap between anchors visualized as a heatpmap: non-binding rules are located in top-left corner of the matrix, while binding rules in the bottom right. Color denotes the number of overlapping rules, with brighter colors indicating a higher number of rules. While there is some overlap of anchors rules within the same data splits (i.e. the binding and non-binding partitions), there is no overlap across splits. That means that no sample fulfills both a binding and a non-binding rule. Right plot shows completeness, i.e. a histogram depicting how many samples (y-axis) fulfill a certain number of anchors (x-axis). With the pipeline settings used for this experiment, most samples do not fulfill any anchor rule, around 300 samples fulfill either 1 or 10 rules, and few fulfill 11 rules. Therefore, the rules obtained in this experiment are not a complete set of rules

