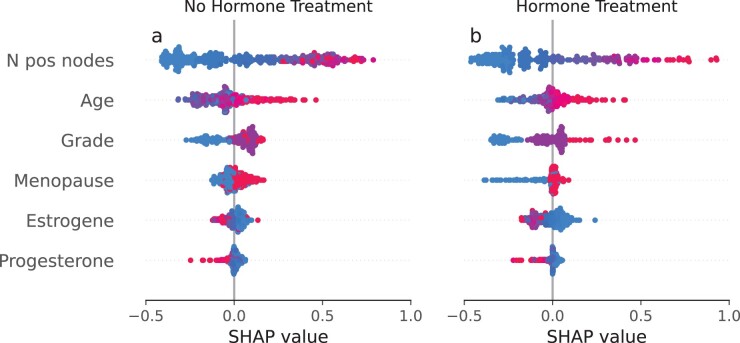
Fig. 4.
SHAP (SHapley Additive exPlanations) values for the best selected BITES model on the controlled randomized test samples of the RGBSG data. Red points correspond to high and blue points to low feature values. A positive SHAP value indicates an increased hazard and hence decreased survival chances and vice versa (A color version of this figure appears in the online version of this article)

