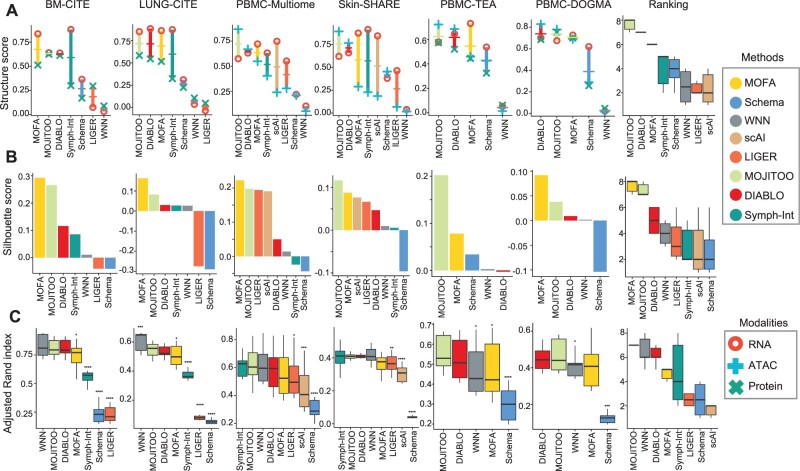
Fig. 2.
Benchmarking on data integration methods. (A) We show the average (trace) and modality-specific structure scores (dots) (y-axis) versus methods (x-axis) for the six datasets. The last graph shows the combined ranking of the method over all datasets, where the highest rank indicates the best performer. (B) Barplots showing silhouette score (y-axis) versus methods (x-axis) for six benchmark datasets. The last plot shows the combined ranked per method. (C) Boxplots showing ARI scores (y-axis) versus methods (x-axis) for distinct clustering solutions for all six data-sets. Asterisks indicate P-values of <0.05(*), <0.01(**), <0.001(***), <0.0001(****) obtained via t-test comparing the ARI values of MOJITOO versus other methods. The last boxplot shows the combined ranking for competing methods

