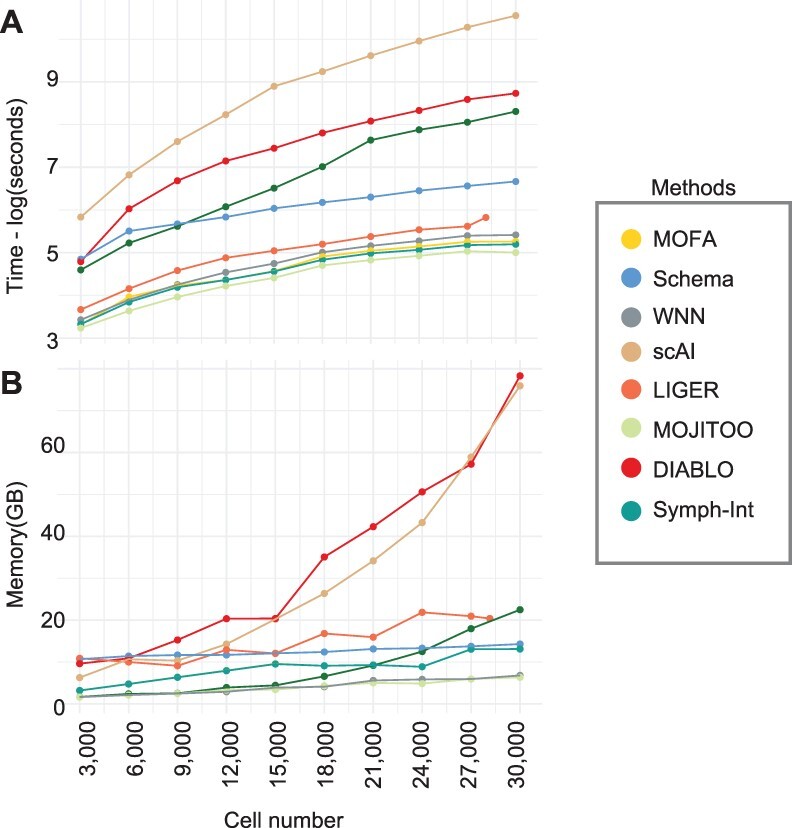
Fig. 3.

Time and memory consumption on the Skin-SHARE. (A) Line plots showing elapsed time (log of seconds) for each method (y-axis). (B) Line plots showing peak memory (Gigabytes) required by each method (y-axis). In both A–B, the x-axis shows the number of cells used (randomly sampled) from the Skin-SHARE data
