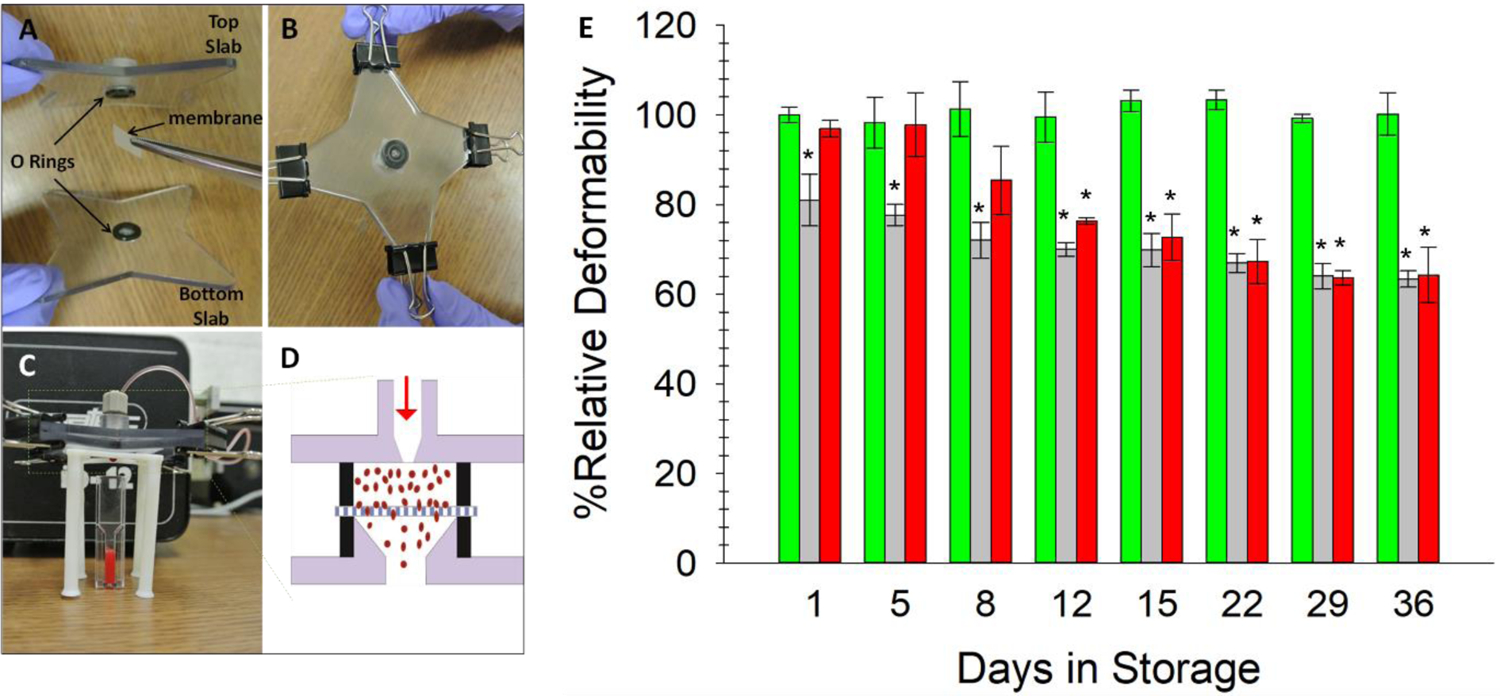
Figure 2:

3D-printed Cell Filter Device for ERY Deformability Measurements. A) The two 3D-printed slabs with holes in the center for O-ring fittings, plus the addition of the 5 μm polycarbonate membrane. B) The two slabs and membrane are secured using binder clips on the four wings. C) A view of the assembled device and experimental set-up. The sample is introduced through the fitting in the top slab and forced through the membrane using a peristaltic pump. Only cells with sufficient deformability will pass through the filter. The cells are then counted with a hemocytometer. D) A schematic cross view of the filtration process within the device. E) AS-1N-PSSN samples (green bars) possessed the highest deformability and maintained a stable level throughout 36 days of storage. AS-1-PSSH samples (light grey bars) showed the least deformability, which also decreased with time. Deformability of ERYs in AS-1-PSSN samples (red bars) were able to completely recover (day 8) to a normal level of deformability or were no longer able to recover (beyond day 12) upon transfer to PSSN. Error bars are ±SEM, n≥3, *p<0.05 to AS-1N-PSSN day 1.
