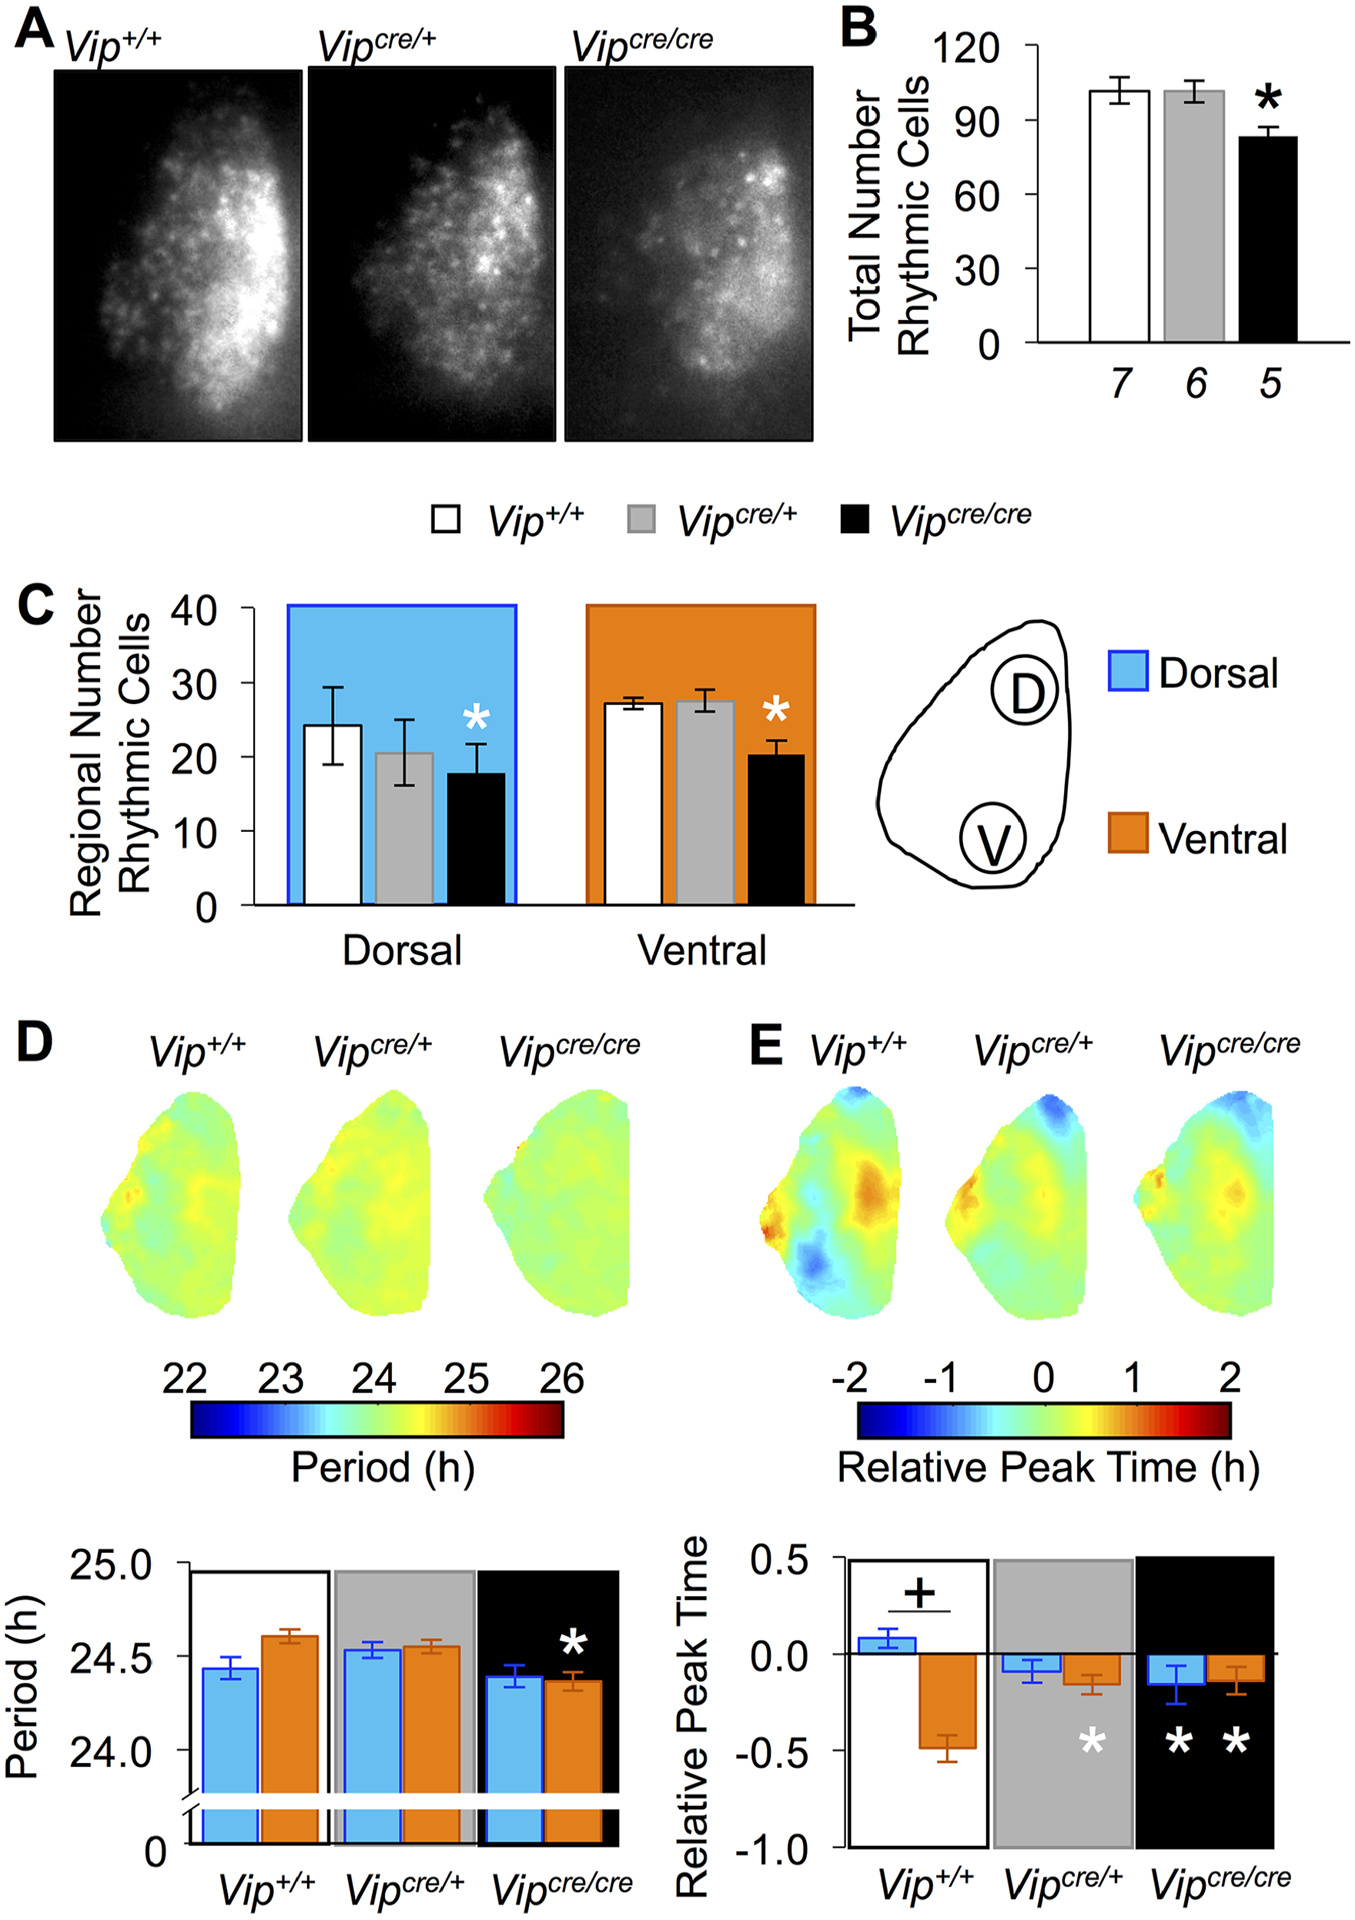
Figure 4.

SCN network function is altered in Vipcre/cre mice. (A) Representative bioluminescence images illustrating summed PER2∷LUC expression over the first 24 h of recording. (B) The total number of rhythmic cells was reduced in Vipcre/cre SCN. (C) Rhythmic cells were reduced in both the dorsal and ventral SCN of Vipcre/cre mice. Schematic illustrates dorsal and ventral regions used for quantification. (D) Period maps and cellular period data demonstrate shorter period in the ventral SCN in Vipcre/cre mice. (E) Phase maps and cellular phase data demonstrate regional phase differences are attenuated in Vipcre/cre SCN. Italicized numbers below the abscissa in (B) indicate the number of SCN slices for each genotype (cellular sample size = 89–184 SCN cells/region). *Differs from the same region in Vip+/+, LSM contrasts, p < 0.05; + differs from complementary SCN region (within genotype), LSM contrasts, p < 0.05.
