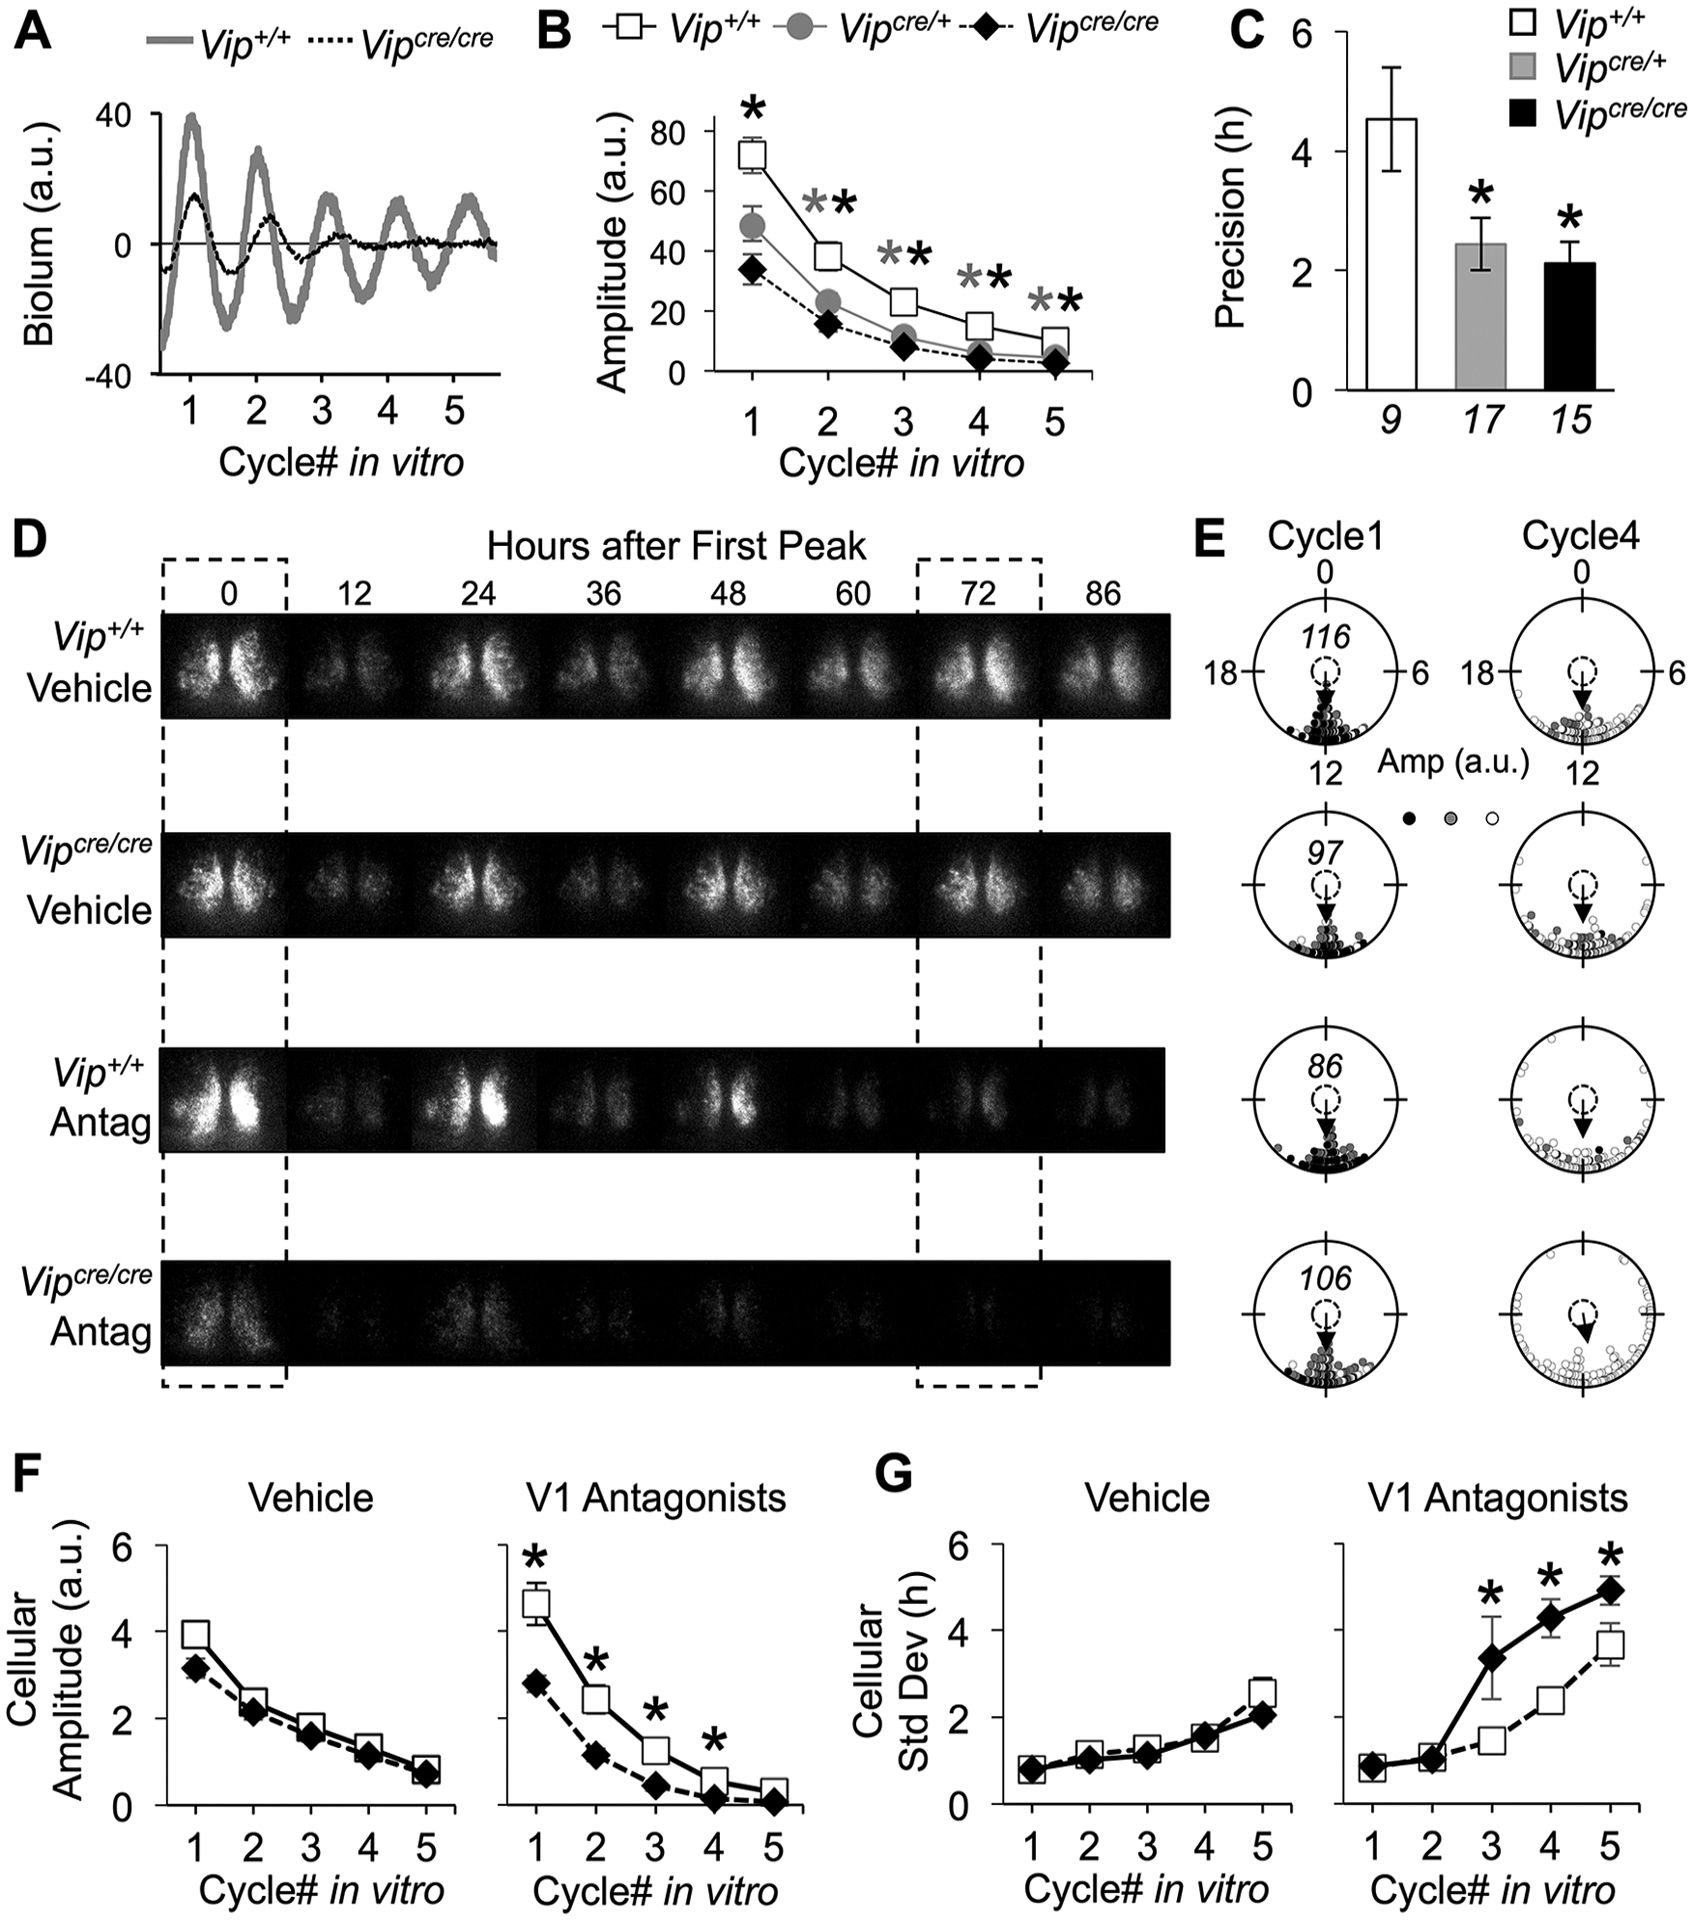
Figure 5.

Arginine vasopressin (AVP) signaling maintains the amplitude and synchrony of Vipcre/cre SCN rhythms. (A) Representative PER2∷LUC time series illustrating SCN bioluminescence rhythms during AVP receptor antagonism. For the color version, see Supplementary Figure S4. (B, C) AVP receptor antagonism decreased the amplitude (B) and precision (C) of PER2∷LUC rhythms in the Vipcre/cre and Vipcre/+ SCN. (D) Representative PER2∷LUC bioluminescence images under vehicle (top) and AVP receptor antagonist (bottom) conditions. The dashed boxes indicate the start of cycle 1 and cycle 4 of the recording. (E) Raleigh plots depicting cellular peak times on the first cycle (cycle 1) and fourth cycle (cycle 4) in vitro for each sample in (D). The amplitude of the PER2∷LUC rhythms for each cell is represented by color saturation (darker = larger amplitude). The italicized number within a plot indicates the number of cells for each sample. (F) AVP receptor antagonism decreased the amplitude of cellular PER2∷LUC rhythms in Vipcre/cre SCN. (G) AVP receptor antagonism increased the standard deviation of cellular peak times in Vipcre/cre SCN slices. Italicized numbers below the abscissa in (C) indicate the number of SCN slices in (B) and (C). For (F-G), n = 3 to 4 SCN slices/genotype/condition (cellular sample size = 86–124 SCN cells/slice). *Differs from Vip+/+, LSM contrasts, p < 0.05.
