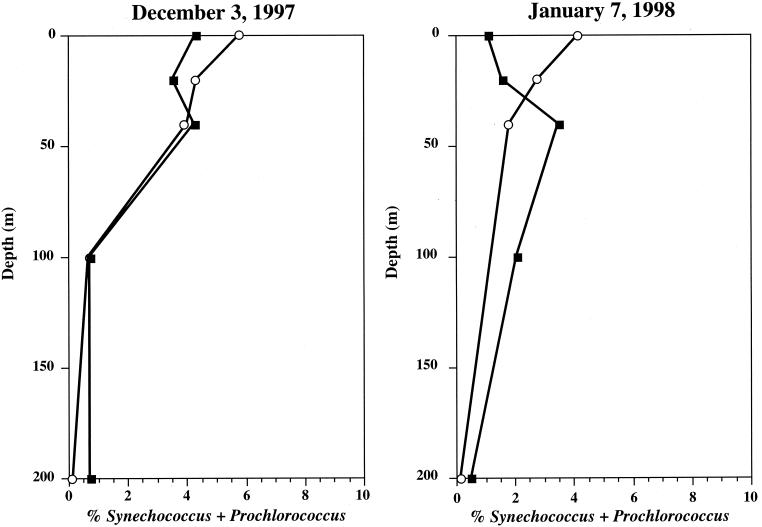
FIG. 4.
Depth profiles of Prochlorococcus and Synechococcus at station M1. Open circles, percentages of Prochlorococcus and Synechococcus SSU rDNAs measured by a 5′-nuclease assay using set PHPICO relative to bacterial SSU rDNA measured by a 5′-nuclease assay using set BACT2; closed squares, percentages of Prochlorococcus and Synechococcus cell numbers relative to total bacterioplankton cell numbers measured by flow cytometry.

