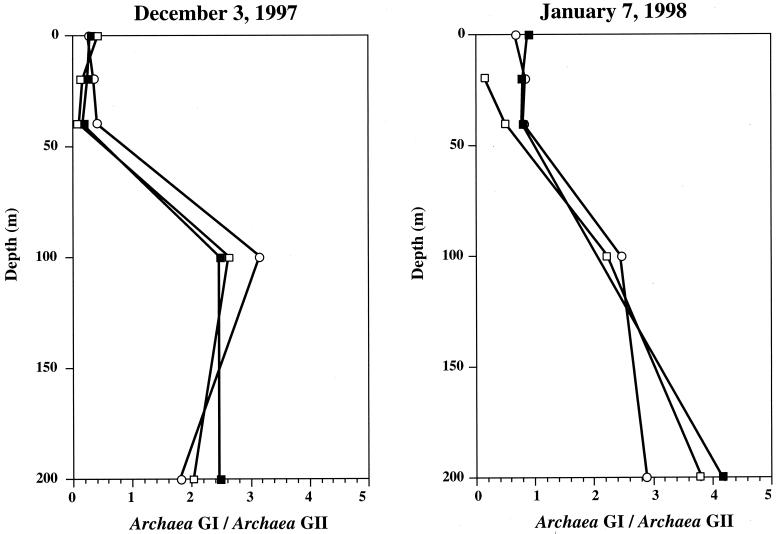
FIG. 5.
Depth profiles of ratios between group I (GI) marine Archaea and group II (GII) marine Archaea at station M1. Open circles, ratios of SSU rRNAs measured by radiolabeled oligonucleotide dot blot hybridization; open squares, ratios of cell numbers per milliliter estimated using fluorescence-labeled polyribonucleotide probes and FISH; closed squares, ratios of SSU rDNA copies per nanogram of DNA estimated by 5′-nuclease assays using primer and probe sets ARCHGI and ARCHGII for group I and group II, respectively.

