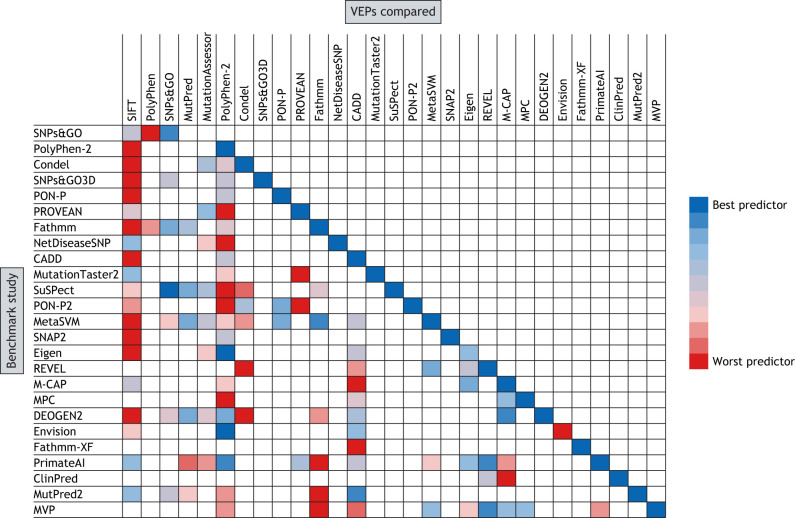
Fig. 1.
Relative VEP performances in self-benchmarking analyses. The VEPs at the left are those that published a benchmark in their method paper. The VEPs at the top were compared within these benchmarks. Owing to space constraints, we could not include all VEPs compared in each study. We took the reported performance metrics, such as ROC AUC, directly from each paper. These scores were then used to rank each predictor from best to worst performance in each benchmark. Where multiple performance metrics were available, we selected a single representative measurement – i.e. ROC AUC when possible – followed by balanced accuracy and then any other presented metric. In cases where multiple benchmarks were performed, we selected one that– if available – used data independently of VEP training or, if not, the most-prominent analysis within the paper. ROC AUC, receiver operating characteristic area under the curve.

