Fig. 3.
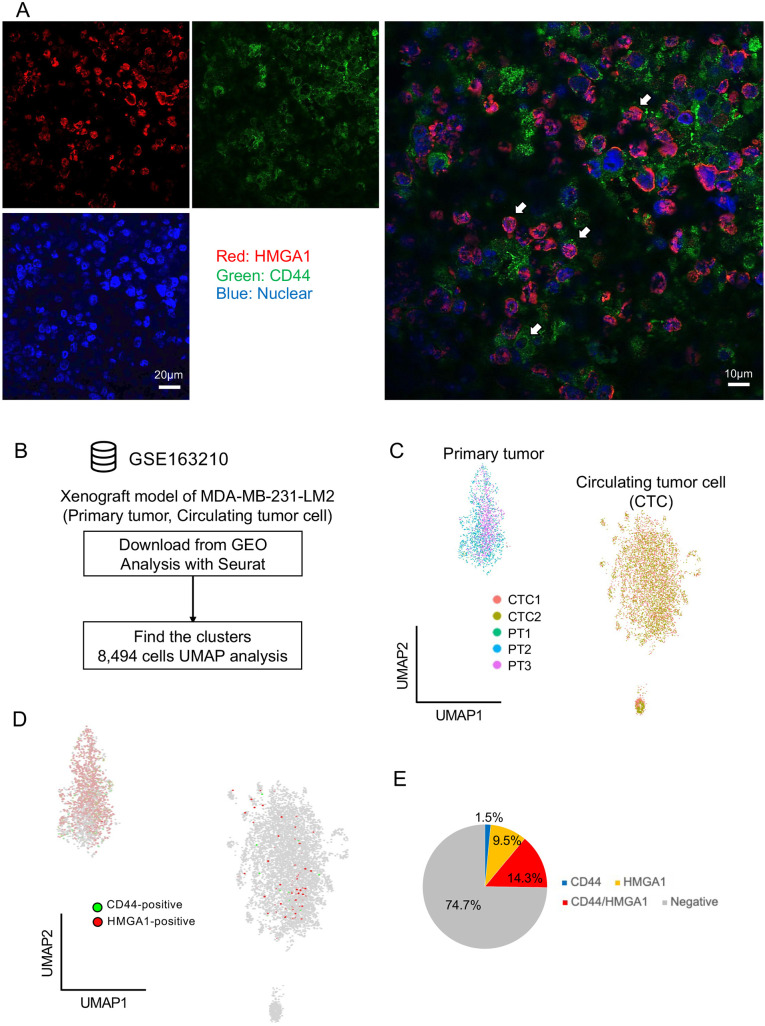
Two CSC-like populations detected by immunostaining and scRNA-seq analysis. (A) Representative images of CD44 and HMGA1 immunostaining in primary tumor sections from the MDA-MB-231 xenograft model. Red, HMGA1; green, CD44; blue, nuclei. Scale bars: 20 μm (left), 10 μm (right). White arrows represent cancer cells with independent expression or co-expression. (B) Flowchart of public single-cell RNA-sequencing (scRNA-seq) reanalysis using the GSE163210 dataset. (C) UMAP plot of MDA-MB-231-LM2 xenograft tumors and circulating tumor cells. (D) Expression of CD44 and HMGA1 in the UMAP plot. (E) Pie chart of the cancer stem cell (CSC)-like population proportion in MDA-MB-231-LM2 xenografts.

