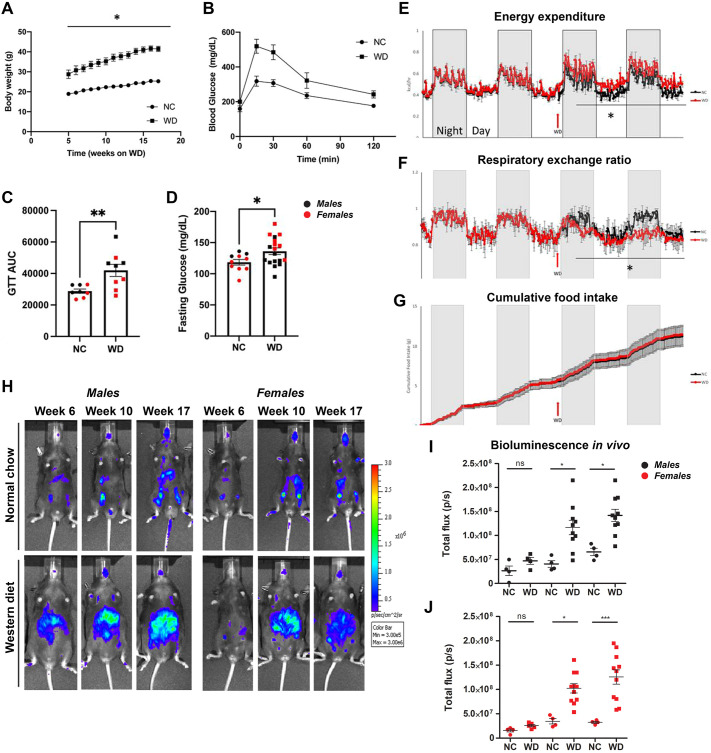
Fig. 1.
Obese mice exhibit gradual increase in whole-body caspase-1 activation in vivo. (A) Body weight of normal chow (NC)-fed and Western diet (WD)-fed mice. (B) Glucose tolerance test (GTT) comparison between NC-fed and WD-fed mice. (C) Representative GTT area under the curve (AUC). (D) Overnight fasting blood glucose levels. (E-G) Energy expenditure (E), respiratory exchange ratio (F) and cumulative food intake (G) from NC-fed and WD-fed biosensor mice. (H-J) Representative in vivo IVIS images (H) and bioluminescence quantification (I,J) from NC-fed and WD-fed male and female mice. Unpaired two-tailed Student's t-test between NC and WD with repeated measures (A); unpaired two-tailed Student's t-test between NC and WD (B-G); paired two-tailed Student's t-test comparing bioluminescence between NC and WD across the indicated time points (I,J). All values represent mean±s.e.m. ns, not significant; *P<0.05, **P<0.01, ***P<0.001. n=4-8 mice per group.

