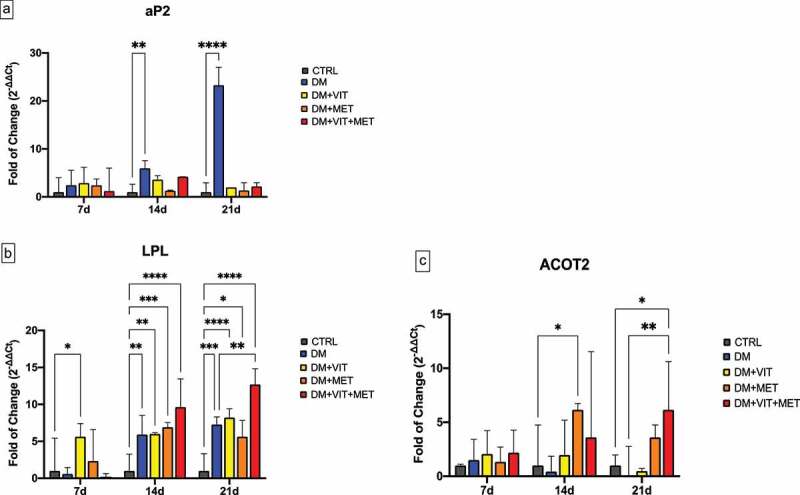
Figure 1.

Expression of key adipogenesis regulatory genes. The expression of the adipogenesis orchestrating genes aP2 (Panel A), LPL (Panel B) and ACOT2 (Panel C) was evaluated after 7, 14 and 21 days in ADSCs cultured in the presence of adipogenic differentiation medium (DM) (blue bars), or in DM in the presence of vitamin D (DM+VIT) (yellow bars), or in DM in the presence of metformin (DM+MET) (Orange bars), or in DM with both metformin and vitamin D (DM+VIT+MET) (red bars), as compared to control untreated cells (grey bars). The mRNA levels for each gene were normalized to Glyceraldehyde-3-Phosphate-Dehydrogenase (GAPDH) and expressed as fold of change (2−∆∆Ct) of the mRNA levels observed in undifferentiated control ADSCs defined as 1 (mean ±SD; n = 6). Kruskal–Wallis rank sum, two-way analysis-of-variance ANOVA tests with Tukey’s correction and Wilcoxon signed-rank test were used. Data are expressed as mean ± SD referred to the control (* p ≤ 0.05; **p ≤ 0.01; ***p ≤ 0.001; ****p ≤ 0.0001).
