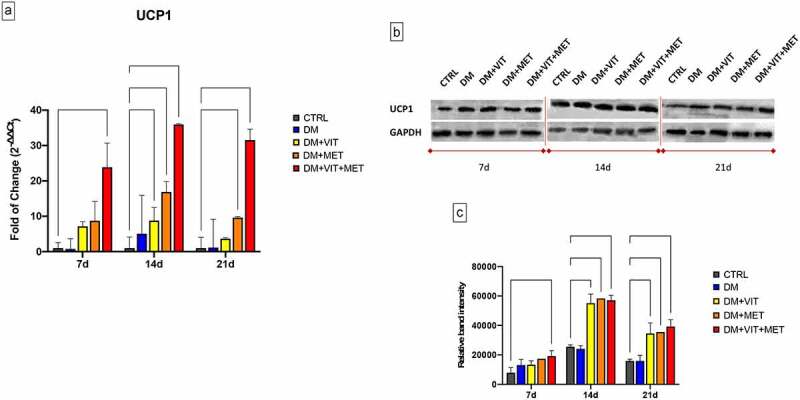
Figure 2.

Expression of brown adipocyte specific UCP1 gene. A) The levels of UCP1 mRNA expression were evaluated after 7, 14 and 21 days in ADSCs cultured in the presence of adipogenic differentiation medium (DM) (blue bars), or in DM in the presence of vitamin D (DM+VIT) (yellow bars), or in DM in the presence of metformin (DM+MET) (Orange bars), or in DM with both metformin and vitamin D (DM+VIT+MET) (red bars), as compared to control untreated cells (grey bars). The mRNA levels were normalized to Glyceraldehyde-3-Phosphate-Dehydrogenase (GAPDH) and expressed as fold of change (2−∆∆Ct) of the mRNA levels observed in undifferentiated control ADSCs defined as 1 (mean ±SD; n = 6). Kruskal–Wallis rank sum, two-way analysis-of-variance ANOVA tests with Tukey’s correction and Wilcoxon signed-rank test were used. Data are expressed as mean ± SD referred to the control (* p ≤ 0.05; **p ≤ 0.01; ***p ≤ 0.001; ****p ≤ 0.0001). B) The protein levels were analysed after 7, 14 and 21 days by Western blot, using monoclonal antisera against UCP1 and GAPDH. The sizes of the bands were determined using pre-stained marker proteins. The data presented are representative of different independent experiments. C) Relative band intensity was measured with ImageJ software. Data are expressed as mean ± SD referred to the control (* p ≤ 0.05; **p ≤ 0.01; ***p ≤ 0.001; ****p ≤ 0.0001).
