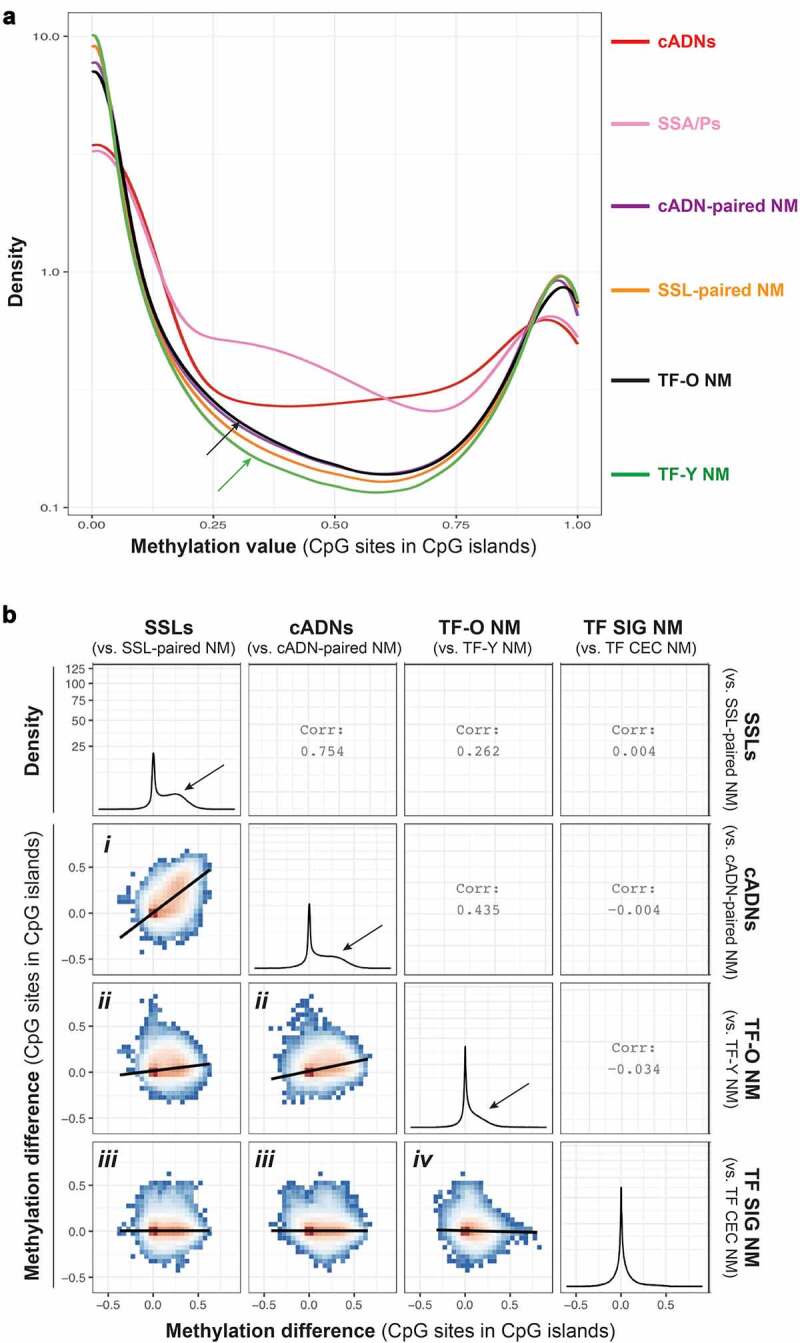
Figure 2.

The CpG island hypermethylation phenotype in tumours and ageing NM. a. Density plot showing the methylation value at CpG sites within CpG islands in tumours (cADNs and SSLs) and in NM samples from cADN donors, SSL donors, older (>70) TF donors (TF-O), and younger (<40) TF donors (TF-Y). Methylation levels in each tumour type clearly exceed levels in any of the four classes of NM. Levels in TF-O NM (black arrow) were only slightly higher than those in TF-Y NM (green arrow). Methylation values were calculated for the 1,060,602 CpG sites remaining after the exclusion of sites displaying 0 methylation in all tissue samples. The y-axis was log10-transformed. b. Six ggpairs plots comparing the methylation changes identified in tumours (i.e., methylation difference between SSLs, or cADNs, and matched samples of NM) with those associated with NM ageing (NM samples from TF donors >70 vs. TF donors <40) and with changes associated with the anatomical location of the NM sample of TF donors (SIG vs. CEC). Methylation difference on axes refers to the methylation proportions change, as defined by dmrseq (see Methods). Methylation differences were calculated for 653,484 CpG sites in CpG islands. Colours in ggpairs plots represent the density of points per square, e.g., red bins contain the highest density of points. Regression lines are drawn over each ggpairs plot. Numbers in empty quadrants correspond to the Pearson correlations (Corr) of each ggpairs plot. As for the four density plots, the y-axis was square root-transformed. Black arrows in these plots indicate the magnitude of hypermethylation in tumours and in the TF-O NM samples. (Abbreviations as defined in Figure 1.).
