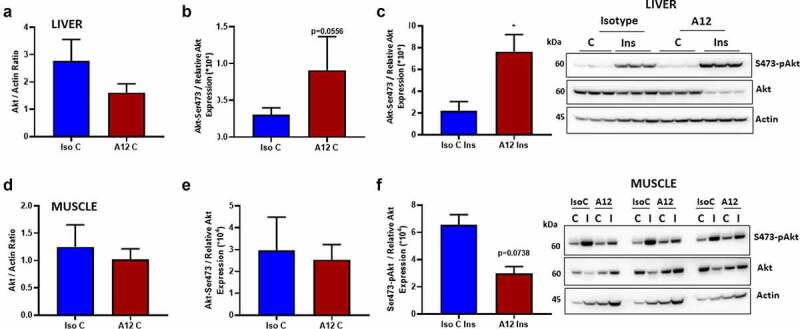
Figure 6.

Examination of the effects of cixutumumab (A12), a specific antibody leading to internalization and degradation of the insulin like growth factor-1 receptor (IGF-1 R) on insulin-induced serine-473 phosphorylation of Akt in liver and muscle in fasted mice. Male C57BL/6 J mice were fed a high fat diet for 6-weeks and received 10 mg/kg cixutumumab or isotype control (IC) every 3 days by intraperitoneal injection for 3 weeks, 21 days after commencing diet: Isotype Control (IsoC) and cixutumumab (A12)-treated high fat-fed mice were injected with Insulin (Ins; (0.75 unit/kg: Actrapid, n = 5) or vehicle control (C; n = 5). (a) No significant difference in total Akt expression in liver between cixutumumab (A12) and isotype control (IsoC)-treated mice fed high fat diet (n = 5 each group) injected with vehicle (n = 5). (b) There was a strong statistical trend towards increased phosphorylation of Akt (Akt-Ser473) in liver between cixutumumab (A12) and isotype control (IsoC)-treated mice on high fat diet injected with vehicle control (n = 5). (c) Insulin-stimulated (Ins) Serine-473 phosphorylated Akt (Akt-Ser473) was significantly greater in liver of cixutumumab-treated (A12) mice compared to isotype control (Iso C)-treated mice fed high fat diet (n = 5). (d) No significant difference in total Akt expression in muscle between cixutumumab (A12) and isotype control (IsoC)-treated mice fed high fat diet (n = 5) injected with vehicle. (e) No significant difference was observed in the phosphorylation levels of Akt (Akt-Ser473) in muscle between cixutumumab (A12) and isotype control (IsoC)-treated mice on high fat diet injected with vehicle control (n = 5). (f) No statistical difference was seen in the insulin-stimulated (Ins) Akt phosphorylation in muscle of cixutumumab-treated (A12) mice compared to isotype control (Iso C)-treated mice fed high fat diet (n = 5). Representative blot shown in the left-most panels of Akt. Akt-Ser473/Relative Akt expression was calculated as Akt-Ser473/(Akt/Actin). Data expressed as mean (SEM),* denotes P < 0.05, n denotes number of mice per group, comparisons made using unpaired student's t test, using Mann Whitney test.
