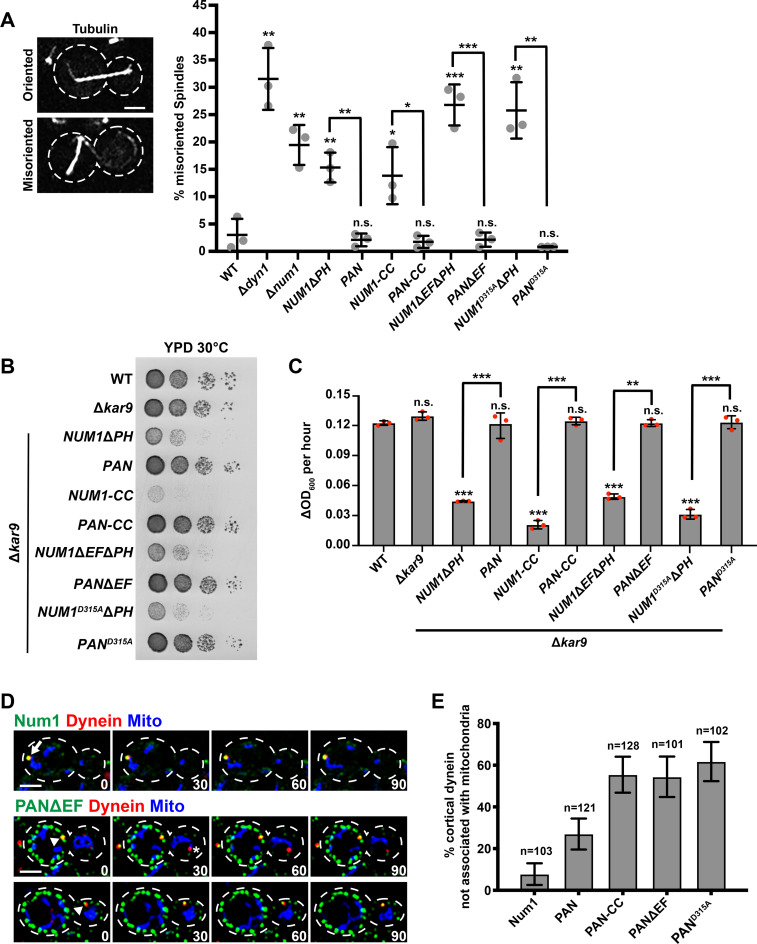
FIGURE 2:
Synthetically clustered Num1 truncations can function in the dynein pathway, but mitochondria and dynein anchoring are uncoupled. (A) WT W303, Δdyn1, Δnum1, NUM1ΔPH, PAN, NUM1-CC, PAN-CC, NUM1ΔEFΔPH, PANΔEF, NUM1D315AΔPH, and PAND315A cells expressing mRuby-Tub1 were visualized by fluorescence microscopy. Representative whole-cell max projections of cells with spindles scored as correctly oriented and misoriented are shown. Large buds with spindles ≥1.75 μm were scored. n = 3 independent experiments of ≥102 spindles for each replicate. Quantification of the percent of cells with misoriented spindles is shown as the mean ± SD with each dot representing an individual replicate for each strain. The cell cortex is outlined with a dashed line. Bars, 2 μm. p values are in comparison to WT W303 except when denoted by brackets. *** p < 0.001, ** p < 0.01, * p < 0.04; n.s., not significant. (B) Tenfold serial dilutions of WT W303, Δkar9, Δkar9 NUM1ΔPH, Δkar9 PAN, Δkar9 NUM1-CC, Δkar9 PAN-CC, Δkar9 NUM1ΔEFΔPH, Δkar9 PANΔEF, Δkar9 NUM1D315AΔPH, and Δkar9 PAND315A were plated on YPD medium and grown at 30°C for 24 h. This is a representative example of four replicates. (C) The change in OD600 per hour for the linear portion of growth curves obtained using a microplate reader for WT, Δkar9, Δkar9 NUM1ΔPH, Δkar9 PAN, Δkar9 NUM1-CC, Δkar9 PAN-CC, Δkar9 NUM1ΔEFΔPH, Δkar9 PANΔEF, Δkar9 NUM1D315AΔPH, and Δkar9 PAND315A. Three individual biological replicates are shown, each represented by a dot. Each biological replicate is the average of three to four technical replicates; mean ± SD is shown. p values are in comparison to WT W303 unless otherwise denoted by brackets. *** p < 0.0001, ** p < 0.0003; n.s., not significant. (D) Representative images of cortical dynein foci associated with mitochondria (top) and not associated with mitochondria (bottom). NUM1 or PANΔEF cells expressing Dyn1-mKate and mito-TagBFP were visualized by fluorescence microscopy over time. A max projection of three consecutive 0.4 μm slices are shown. Time is in seconds. Arrow indicates a colocalization event with mitochondria. Arrowhead indicates a colocalization event without mitochondria. Asterisk indicates a noncortical dynein focus. The cell cortex is outlined with a dashed line. Bar, 2 μm. (E) Quantification of the percent of cortical dynein foci that are not associated with mitochondria for Num1-yEGFP, PAN, PAN-CC, PANΔEF, and PAND315A. n = number of cortical dynein foci. Error bars represent the SE of proportion with a 95% confidence interval. To be considered cortically anchored, a Dyn1-mKate focus had to remain stably associated with a cluster at the cell cortex for ≥1.5 min.

