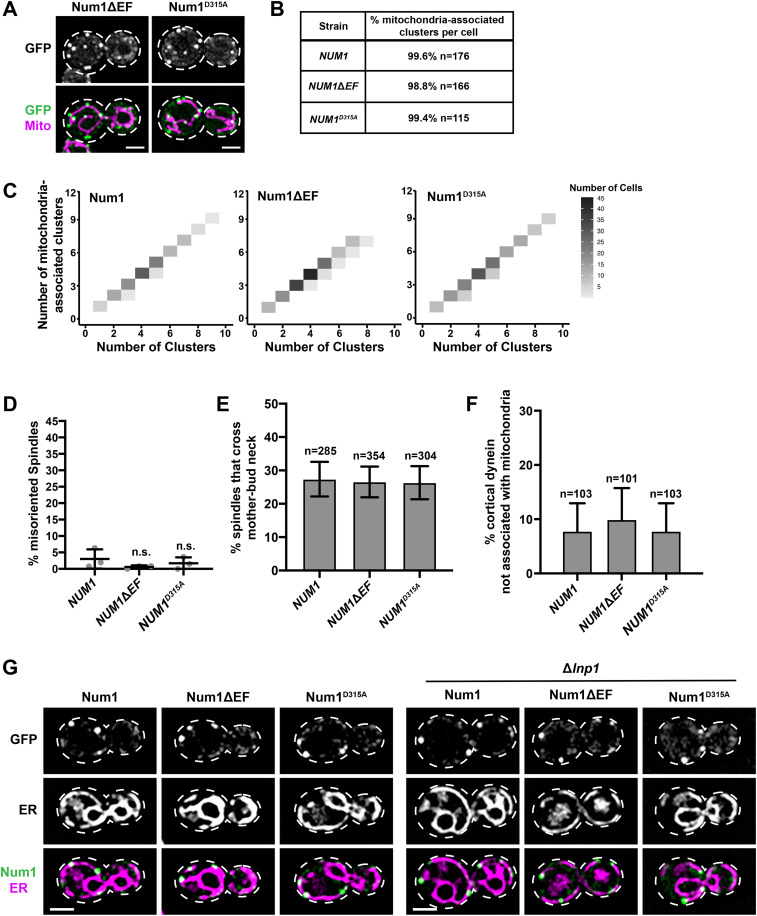
FIGURE 5:
Characterization of clusters, tethers, dynein function, and ER association for full-length Num1 EFLM mutants. (A) Representative images of cells expressing Num1ΔEF-yEGFP and Num1D315A-yEGFP with mito-Red. Whole-cell max projections are shown. The cell cortex is outlined with a dashed white line. Bar, 2 µm. (B) The table describes the average percentage of Num1ΔEF-yEGFP and Num1D315A-yEGFP clusters that are mitochondria-associated per cell. To be scored as a mitochondria-associated cluster, mitochondria had to remain associated with the cluster for ≥1.5 min. n = number of cells. (C) The number of mitochondria-associated clusters per cell was plotted against the total number of clusters per cell for NUM1 (n = 176), NUM1ΔEF (n = 166), and NUM1D315A (n = 115) cells. The color of each rectangle represents the number of cells, as indicated by the key (right). (D) Quantification of misoriented spindles (as described in Figure 2A) for NUM1 (replicated from Figure 2A), NUM1ΔEF, and NUM1D315A cells. Large buds with spindles ≥1.75 μm were scored. n = 3 independent experiments of ≥102 spindles per replicate. Quantification of the percent of cells with misoriented spindles is shown as the mean ± SD with each dot representing an individual replicate for each strain. n.s. = not significant in comparison to NUM1. (E) Quantification of the percentage of HU-arrested spindles that cross the M-B neck in a 10-min-time-lapse movie for NUM1, NUM1ΔEF, and NUM1D315A cells. n = number of cells. SE of the proportion with 95% confidence interval is shown. (F) Quantification of the percent of cortical dynein foci that do not colocalize with mitochondria at Num1, Num1ΔEF, and Num1D315A clusters. n = number of cortical dynein foci. Error bars represent the SE of proportion with a 95% confidence interval. To be considered cortically anchored, a Dyn1-mKate focus had to remain stably associated with a cluster at the cell cortex for ≥1.5 min. (G) Representative images of cells expressing Num1-yEGFP, Num1ΔEF-yEGFP, and Num1D315A-yEGFP with Pho88-mCherry (ER marker) in the presence (left) or absence (right) of Lnp1. Single slices are shown. The cell cortex is outlined with a dashed white line. Bar, 2 µm.

