FIGURE 3:
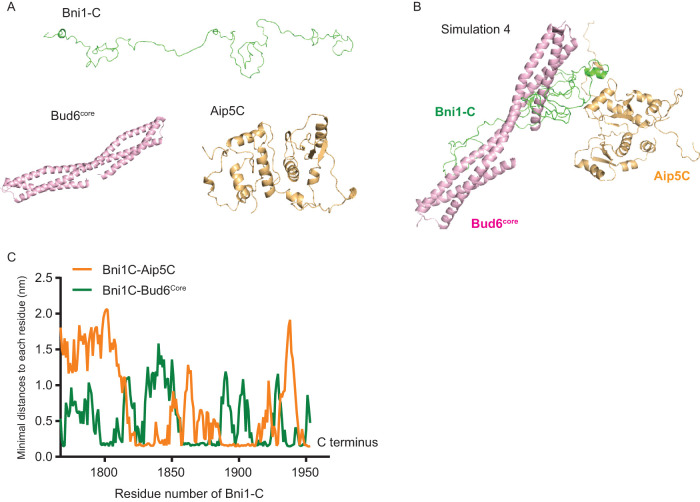
Computer simulation of the complex assembly of Bni1-Bud6-Aip5. (A) Initial structures of Bni1-C, Aip5C, and Bud6core for setting up the MD simulations. (B) The most stable complex conformation (Simulation 4 in Supplemental Figure S2) from MD simulations among the eight randomly positioned nucleation complexes (Bni1-C, green; Aip5C orange; Bud6C, pink). (C) The minimal distance plot of each residue of Bni1-C from Aip5C (orange) and Bud6core(green), respectively, in the complex conformation in B.

