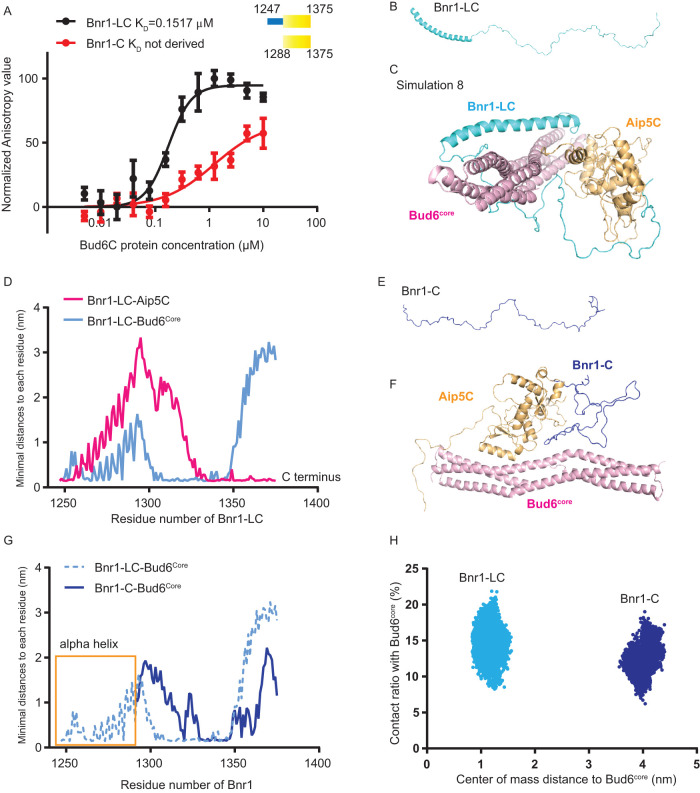
FIGURE 4:
Computer simulation of the complex assembly of Bnr1-Bud6-Aip5. (A) Fluorescence anisotropy binding measurements of Alexa 488-labeled Bnr1-LC (1245-1375 a.a., 30 nM) and Bnr1-C (1288-1375 a.a., 30 nM) by a serial concentration of Bud6C, respectively. The average values from three biological replicates are fitted by the Hill equation to determine the KD. (A.U., arbitrary unit.). (B) The initial structure of Bnr1-LC. (C) The most stable complex conformation (Simulation 8 in Supplemental Figure S4) among the eight sets of Bnr1-Bud6-Aip5 MD simulations (Bnr1-LC, cyan; Aip5C, orange; Bud6core, pink). (D) The minimal distance plot of each residue between Bnr1-LC and Aip5C(pink)/Bud6core (blue) in the final stable complex conformation, as shown in Figure 3C. (E) The initial structure of Bnr1-C. (F) The final Bnr1-C- Bud6core -Aip5C complex conformation after MD simulation (Bnr1-C, blue; Aip5C, orange; Bud6core, pink). (G) The minimal distance plot of each residue between Bnr1-LC (light blue, dashed curve) and Bnr1-C (dark blue, solid curve) with Bud6core in the final stable complex conformation. (H) The conformational distribution of Bnr1-LC/Bnr1-C as a function of the contact ratio (percentage of residues contacting with Bud6core) and the center of mass distance to Bud6core.

