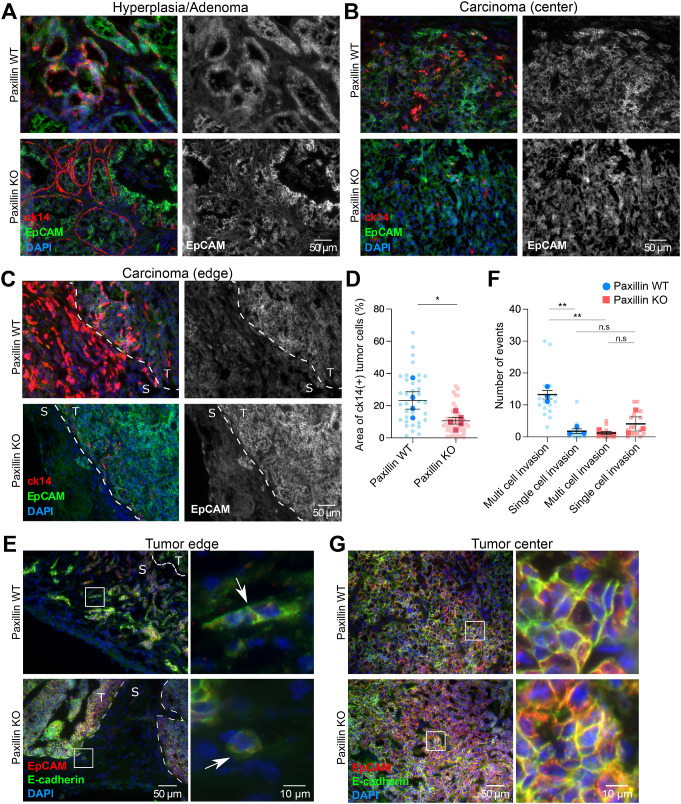
FIGURE 2:
Paxillin KO primary tumors are less invasive. Representative tumor sections from (A) early stage (hyperplasia or adenoma) tumors and the center (B) and the edge (C) of late stage (carcinoma) tumors stained for the tumor marker EpCAM and invasiveness marker ck14. The gray scale images show EpCAM-positive tumor cells. T, tumor; S, stroma. (D) Quantification of area of ck14 positive tumor cells; n (paxillin WT) = 4 animals, n (paxillin KO) = 5 animals. Each dot represents one image. (E) Paxillin WT tumor cells invade into the stroma collectively at the tumor edge (arrow top); few paxillin KO tumor cells invade into the stroma, and these were individual cells (arrow bottom). (F) Quantification of multicell, collective invasion and single cell invasion. Each string/group of tumor cells or a single cell in the stroma was counted as an event; n = 3 animals per genotype. (G) E-cadherin-mediated cell–cell junction organization is not affected in the tumor center of either paxillin WT or paxillin KO animals. A Student’s t test was performed for statistical analysis. Data represent mean ± SEM *< 0.05, **< 0.01.

