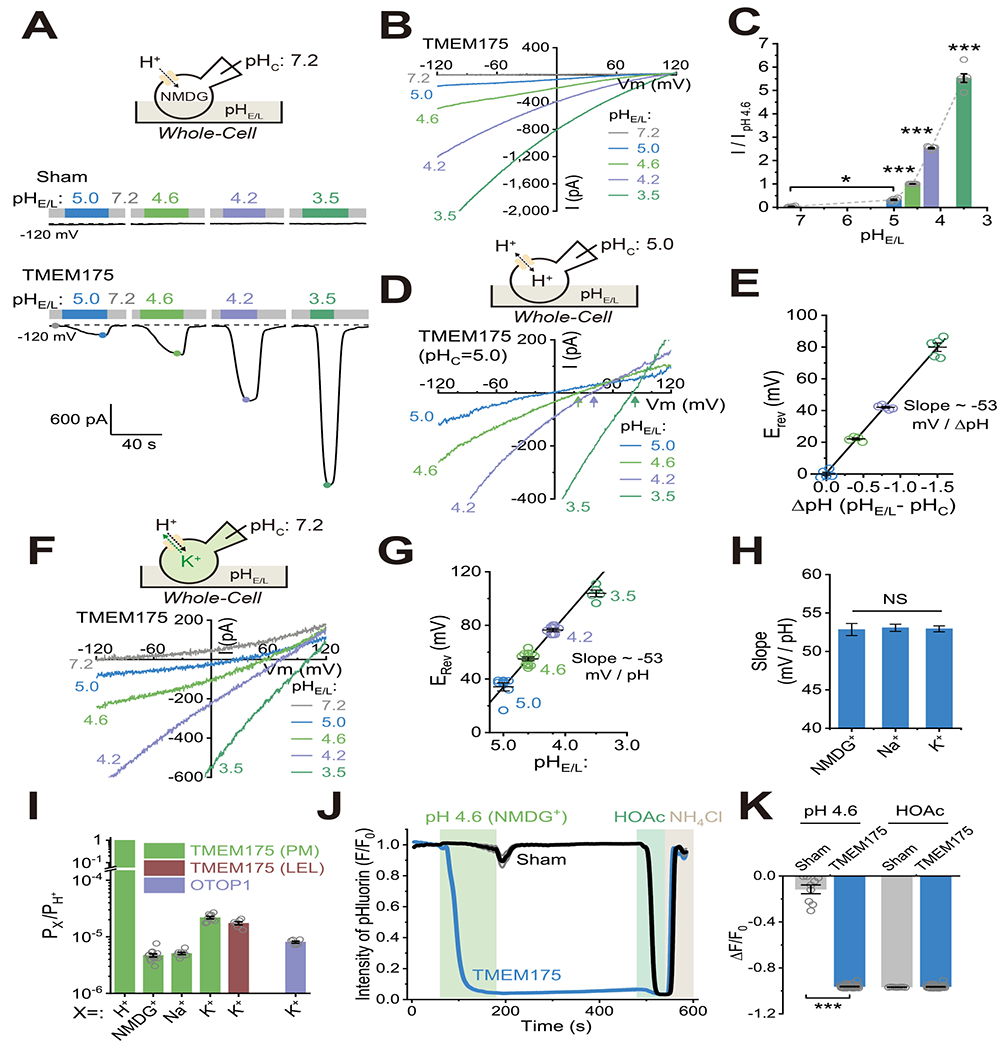
Figure 2. The TMEM175 channel is highly proton selective.

(A-B) Whole-cell currents recorded in an HEK293T cell overexpressing TMEM175 or a vector transfected (sham) cell. pHC was set to 7.2 and extracellular pH (pHE/L) varied as indicated. Unless otherwise indicated, all recording solutions (bath/extracellular and pipette/cytosolic) contained NMDG-MSA as the major ions. (C) Summary of whole-cell TMEM175 currents (ITMEM175) at −120 mV normalized to current at pHE/L = 4.6 (n = 6 cells, mean ± SEM, * p <0.05, *** p <0.001). Summary of whole-cell macroscopic conductance is shown in Supplemental Fig. S3A. (D) Erev measured in an HEK293T cell overexpressing TMEM175 with pHc set to 5.0 and pHE/L varied as indicated. (E) Erev as a function of ΔpH (= pHE/L- pHC) from experiments as in (D). The line fit to the data had a slope of −53 mV/ΔpH (n = 4 - 5, mean ± SEM). (F) Erev of ITMEM175 under “bi-ionic” conditions. The cytosolic solution contained K-MSA instead of NMDG-MSA as the major ions (pHc = 7.2). (G) Analysis of pH-dependence of Erev from experiments as in (F). The line is a least square linear regression fit to the averages of Erev measured at pHE/L 5.0 to 4,2 (n = 5 - 11, slope = −53 mV/ΔpH, mean ± SEM). (H) Summary of slope values in the pH-Erev experiments when NMDG+ (as in D-E), Na+, and K+ (as in F-G) were used as the major ions (n = 4 - 6, mean ± SEM, NS, p > 0.05). (I) Analysis of relative H+ permeability over NMDG+, Na+, or K+ based on Erev measurement (n = 6 - 13). The estimated PK/PH for the OTOP1 H+ channel, measured using the same recording conditions, is shown for comparison. Note that an incomplete block (by TEA+) of background K+ channels present in the HEK293T plasma membrane (PM) might make a contaminating contribution to PK, hence leading to an underestimated PH/PK value for TMEM175 on the PM compared with on LELs. Additionally, the outward currents may also contain a contaminating component of H+, currents due to experimentally-induced cytosolic H+ accumulation (see Methods). (J) Average pHlourin fluorescence in TMEM175-transfected HEK293T cells (n > 30 cells per coverslip) in response to stimuli as indicated. Imaging solutions contained NMDG-MSA as the major ions. HOAc (pH 5.0) and NH4Cl (pH 7.2), which freely enter the cytosol, served as positive and negative controls to acidify or alkalinize the cytosol, respectively. (K) Summary of relative pHluorin fluorescence intensity in response to pHE/L 4.6 and HOAc (sham/TMEM175: n = 9/35, mean ± SEM, *** p <0.001). See Supplemental Fig. S3K–O for similar experiments using other imaging solutions. N represents the number of cells randomly selected from at least three independent biological replicates.
