
Figure 6. Proton permeation through TMEM175 is required for lysosomal pH homeostasis and effective proteolytic degradation.
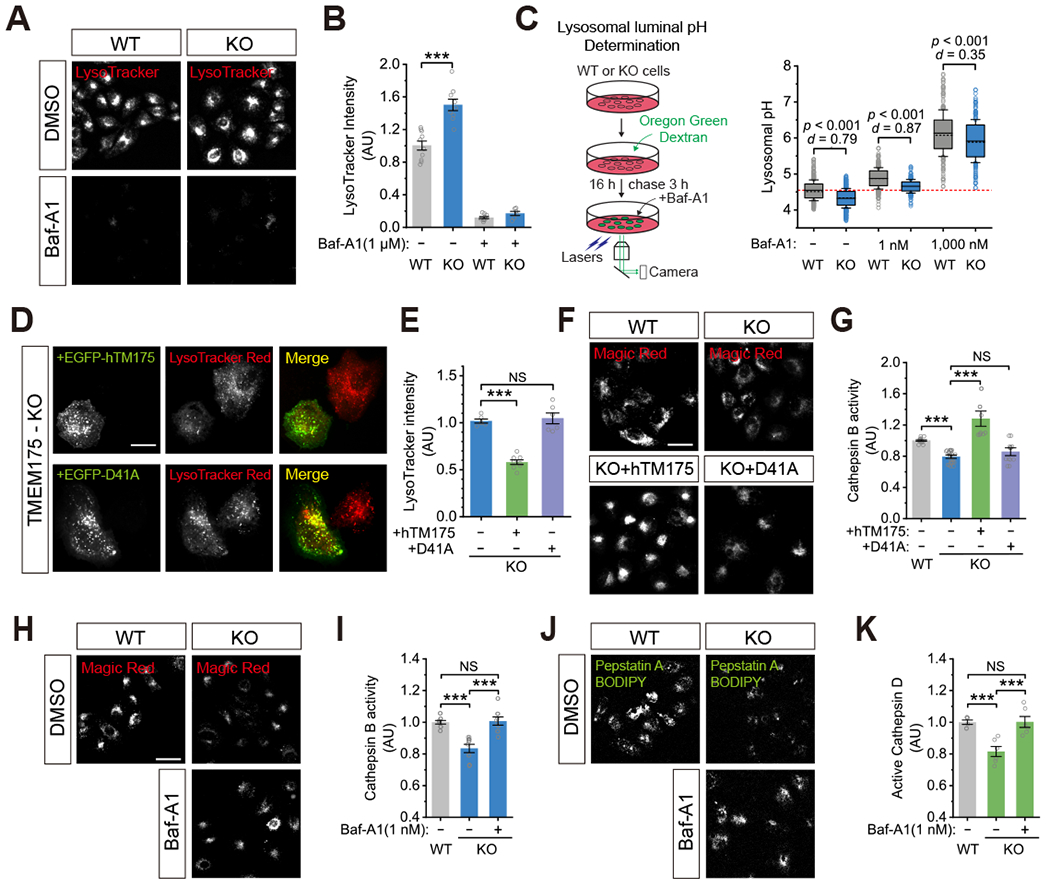
(A-B) Lysosomal acidity assessed by LysoTracker (red) staining in WT and TMEM175 KO HeLa cells (scale bar = 50 μm). Plots show the overall LysoTracker intensity per cell (n = 6-10 randomly selected images from at least three independent biological repeats, *** p <0.001). Cells incubated with 1 μM Baf-A1 for 1 hour served as a positive control. (C) Lysosomal pH in WT and KO HeLa cells determined using Oregon Green Dextran. Baf-A1 was applied to mildly (1 nM) or maximally (1,000 nM) block the V-ATPase to alkalize the lysosomes. The red dashed line represents the mean level from WT cells (n = 177-487 cells per group; Cohen’s d > 0.75 indicates large effects and d = 0.25-0.50 indicates small effects. (D-E) Lysosomal acidity assessed by LysoTracker staining in TMEM175 KO HeLa cells re-expressing WT EGFP-TMEM175 or EGFP-TMEM175-D41A (scale bar = 20 μm, n = 6-8, *** p < 0.001, NS, p > 0.05). (F-G) Lysosomal Cathepsin B activity assayed by Magic Red staining in WT, KO, and KO HeLa cells stably expressing WT TMEM175 or D41A (scale bar = 50 μm, n = 6-13, NS, p > 0.05, *** p < 0.001). (H-I) Lysosomal Cathepsin B activity in WT, KO, and KO cells incubated with Baf-A1 (1 nM) for 30 min (scale bar = 50 μm; n = 6-8, NS, p > 0.05, *** p < 0.001). (J-K) Lysosomal active amount of Cathepsin D assayed by Pepstatin-A-BODIPY-FL staining in WT, KO, and KO cells incubated with Baf-A1 (1 nM) for 30 min (scale bar = 50 μm; n = 6, NS, p > 0.05, *** p < 0.001). All plots show the results from at least three independent biological replicates for each experimental condition.