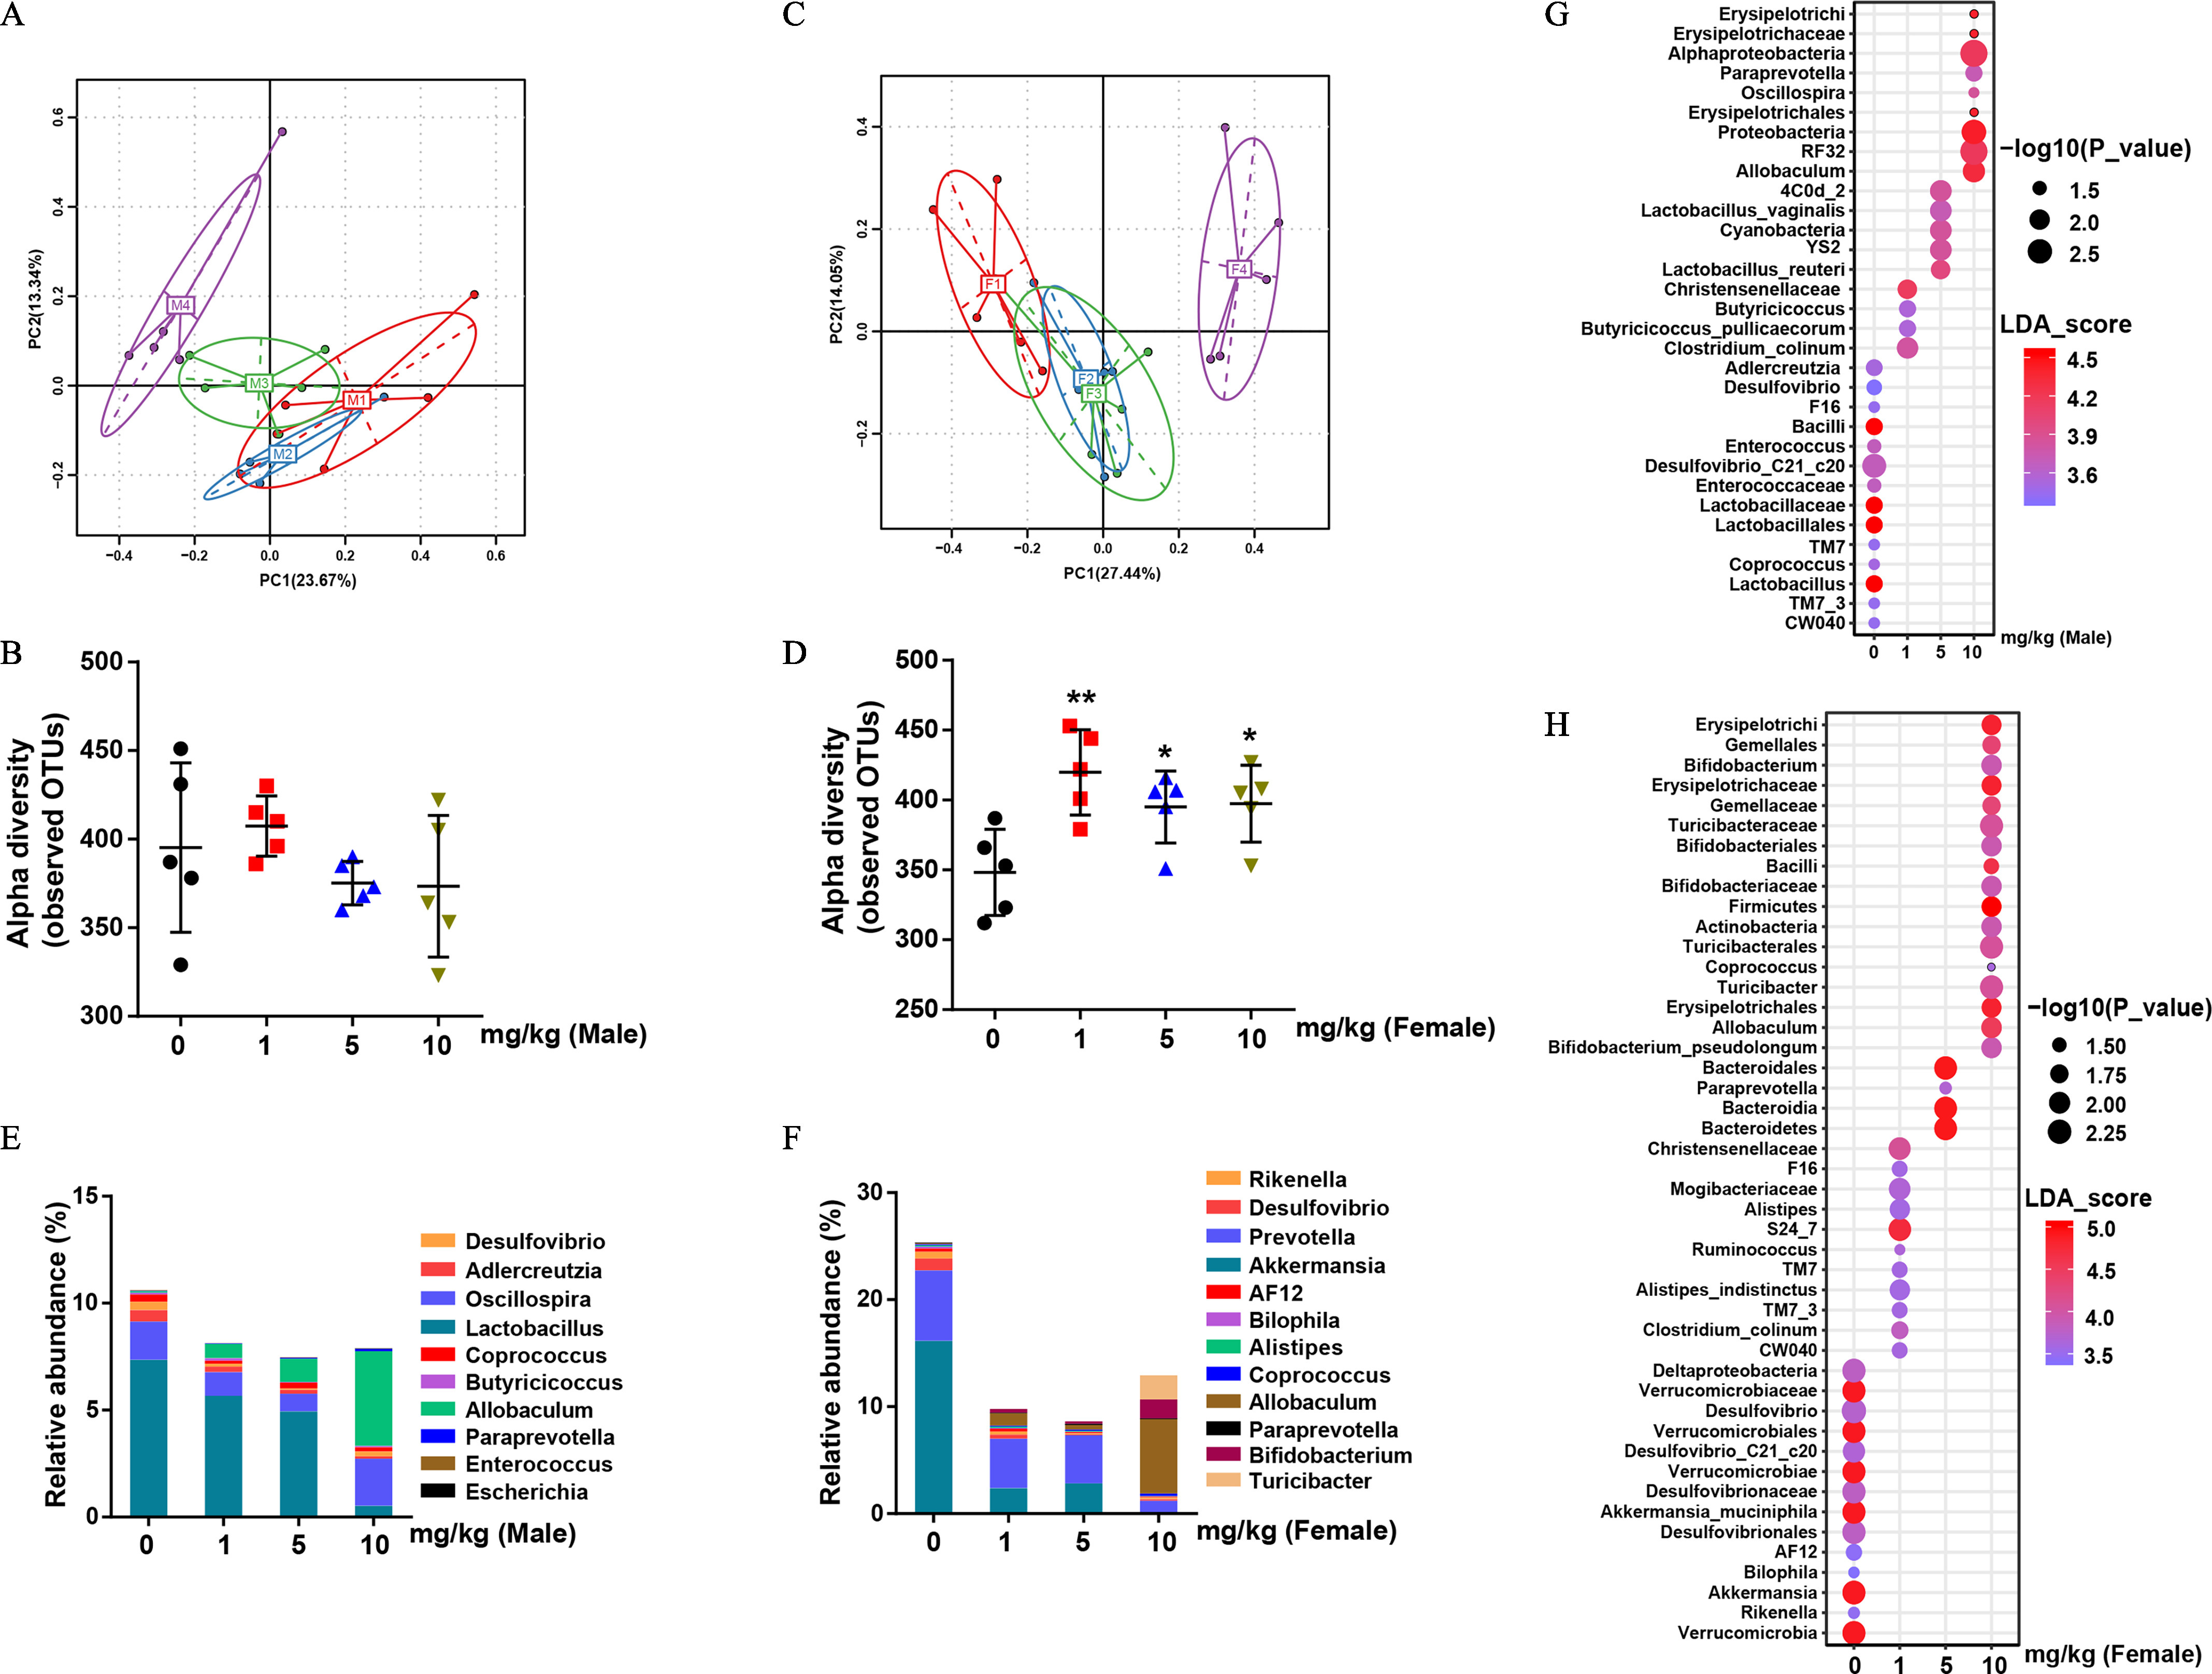
Figure 2.

Bacterial 16S rDNA-based analysis of fecal microbiota of PFOS-exposed mice. (A) PCA plot based on bacterial 16S rDNA gene sequence abundance in the feces of male mice. (B) Alpha diversity of fecal 16S rDNA sequencing data from male mice. (C) PCA plot based on bacterial 16S rDNA gene sequence abundance in the feces of female mice. (D) Alpha diversity of fecal 16S rDNA sequencing data from female mice. (E) and (F) Taxonomic distributions of bacteria from fecal 16S rDNA sequencing data in male (E) and female (F) mice. The bubble plot of linear discriminant analysis (LDA) scores of bacterial 16S rDNA sequences in control and PFOS-exposed male (G) and female (H) mouse feces. ; results were presented as the . Summary data can be found in Table S3 (panels B, D, E, and F) and Excel Tables S1 and S2 (Panels G and H, respectively). Wilcoxon Rank-Sum test was used for the differential analysis between two groups. Kruskal-Wallis test was used for the differential analysis between multigroups. Note: F, female; F1–F4, control, , and , respectively; M, male mice; M1–M4, control, , and , respectively; PFOS, perfluorooctane sulfonate; SD, standard deviation. *. **. *** in comparison with the control group.
