. 2022 Jun 27;130(6):067009. doi: 10.1289/EHP10281

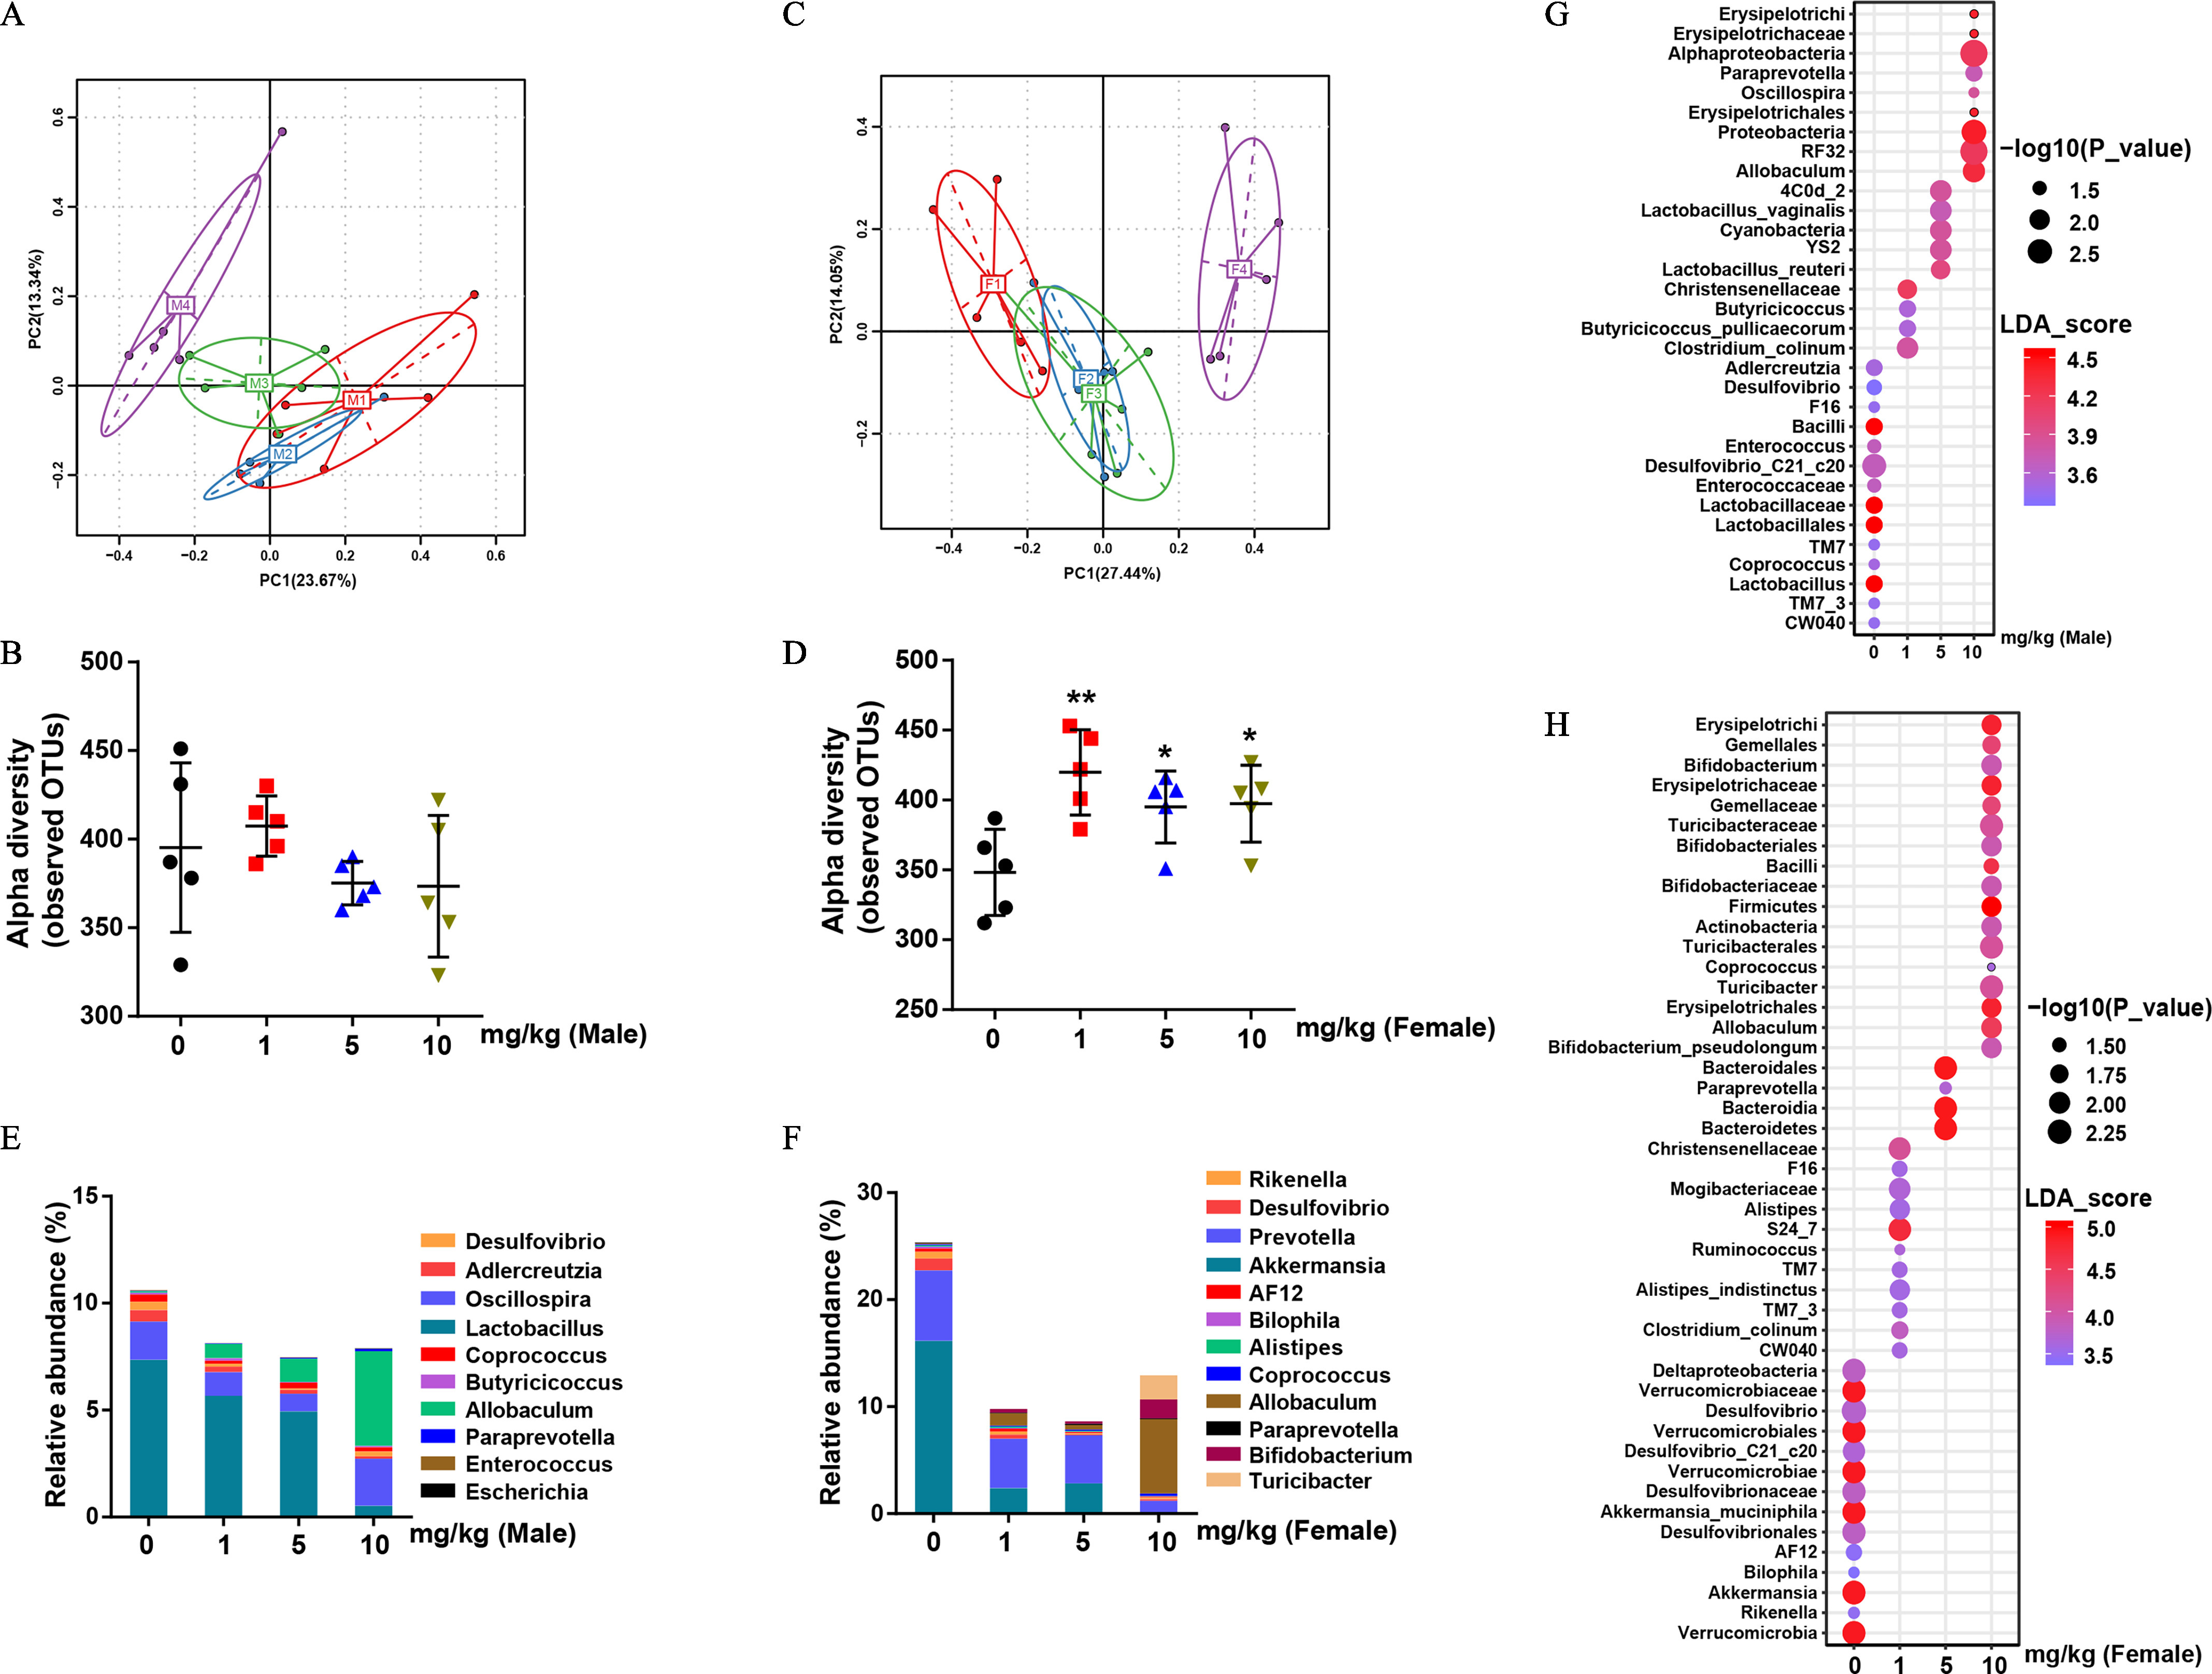
Figure 2.

Figures 2A and 2C are Principal Component Analysis plots, plotting principal component 2 (13.34 percent), ranging from negative 0.2 to 0.6 in increments of 0.2 and principal component 2 (14.05 percent), ranging from negative 0.2 to 0.4 in increments of 0.2 (y-axis) across principal component 1 (23.67 percent), ranging from negative 0.4 to 0.6 in increments of 0.2 and across principal component 1 (27.44 percent), ranging from negative 0.4 to 0.4 in increments of 0.2 (x-axis). Figures 2B and 2D are error bar graphs, plotting Alpha diversity (observed operational taxonomic units), ranging from 300 to 500 in increments of 50 and 250 to 500 in increments of 50 (y-axis) across milligram per kilogram (male) and (female), ranging from 0 to 1 in unit increments and 1 to 10 in increments of 5 (x-axis). Figures 2E and 2F are stacked bar graphs, plotting Relative abundance (percentage), ranging from 0 to 15 in increments of 5 and 0 to 30 in increments of 10 (y-axis) across milligram per kilogram (male) and (female), ranging from 0 to 1 in unit increments and 1 to 10 in increments of 5 (x-axis) for Desulfovibrio, Adlercreutzia, Oscillospira, Lactobacillus, Coprococcus, Butyricicoccus, Allobaculum, Paraprevotella, Enterococcus, and Escherichia; and Rikenella, Desulfovibrio, Prevotella, Akkermansia, A F 12, Bilophila, Alistipes, Coprococcus, Allobaculum, Paraprevotella, Bifidobacterium, and Turicibacter. Figure 2G is a bubble plot, plotting C W 040, T M 7 underscore 3, Lactobacillus, Coprococcus, T M 7, Lactobacillales, Lactobacillaceae, Enterococcaceae, Desulfovibrio underscore C 21 underscore c 20, Enterococcus, Bacilli, F 16, Desulfovibrio, Adlercreutzia, Clostridium underscore colinum, Butyricicoccus underscore pullicaecorum, Butyricicoccus, Christensenellaceae, Lactobacillus underscore reuteri, Y S 2, Cyanobacteria, Lactobacillus underscore vaginalis, 4 C 0 d underscore 2, Allobaculum, R F 32, Proteobacteria, Erysipelotrichales, Oscillospira, Paraprevotella, Alphaproteobacteria. Erysipelotrichaceae. and Erysipelotrichi (y-axis) across milligram per kilogram (male), ranging from 0 to 1 in unit increments and 1 to 10 in increments of 5 (x-axis). A scale depicting negative log to the base 10 of (uppercase p) is ranging from 2.5 to 1.5 in decrements of 0.5. A scale depicting linear discriminant analysis underscore score is ranging from 3.6 to 4.5 in increments of 0.3. Figure 2H is a bubble plot, plotting Verrucomicrobia, Rikenella, Akkermansia, Bilophila, A F 12, Desulfovibrionales, Akkermansia underscore muciniphila, Desulfovibrionaceae, Verrucomicrobiae, Desulfovibrio underscore C 21 underscore c 20, Verrucomicrobiales, Desulfovibrio, Verrucomicrobiaceae, Deltaproteobacteria, C W 040 ,Clostridium underscore colinum, T M 7 underscore 3, Alistipes underscore indistinctus, T M 7, Ruminococcus, S 24 underscore 7, Alistipes, Mogibacteriaceae, F 16, Christensenellaceae, Bacteroidetes, Bacteroidia, Paraprevotella, Bacteroidales, Bifidobacterium underscore pseudolongum, Allobaculum, Erysipelotrichales, Turicibacter, Coprococcus, Turicibacterales, Actinobacteria, Firmicutes, Bifidobacteriaceae, Bacilli, Bifidobacteriales, Turicibacteraceae, Gemellaceae, Erysipelotrichaceae, Bifidobacterium, Gemellales, and Erysipelotrich (y-axis) across milligram per kilogram (female), ranging from 0 to 1 in unit increments and 1 to 10 in increments of 5 (x-axis). A scale depicting negative log to the base 10 of (uppercase p) is ranging from 2.25 to 1.50 in decrements of 0.25. A scale depicting linear discriminant analysis underscore score is ranging from 3.5 to 5.0 in increments of 0.5.

Bacterial 16S rDNA-based analysis of fecal microbiota of PFOS-exposed mice. (A) PCA plot based on bacterial 16S rDNA gene sequence abundance in the feces of male mice. (B) Alpha diversity of fecal 16S rDNA sequencing data from male mice. (C) PCA plot based on bacterial 16S rDNA gene sequence abundance in the feces of female mice. (D) Alpha diversity of fecal 16S rDNA sequencing data from female mice. (E) and (F) Taxonomic distributions of bacteria from fecal 16S rDNA sequencing data in male (E) and female (F) mice. The bubble plot of linear discriminant analysis (LDA) scores of bacterial 16S rDNA sequences in control and PFOS-exposed male (G) and female (H) mouse feces. n=5; results were presented as the mean±SD. Summary data can be found in Table S3 (panels B, D, E, and F) and Excel Tables S1 and S2 (Panels G and H, respectively). Wilcoxon Rank-Sum test was used for the differential analysis between two groups. Kruskal-Wallis test was used for the differential analysis between multigroups. Note: F, female; F1–F4, control, 1mg/kg, 5mg/kg and 10mg/kg, respectively; M, male mice; M1–M4, control, 1mg/kg, 5mg/kg and 10mg/kg, respectively; PFOS, perfluorooctane sulfonate; SD, standard deviation. *p<0.05. **p<0.01. ***p<0.001 in comparison with the control group.