. 2022 Jun 27;130(6):067009. doi: 10.1289/EHP10281

Figure 6.

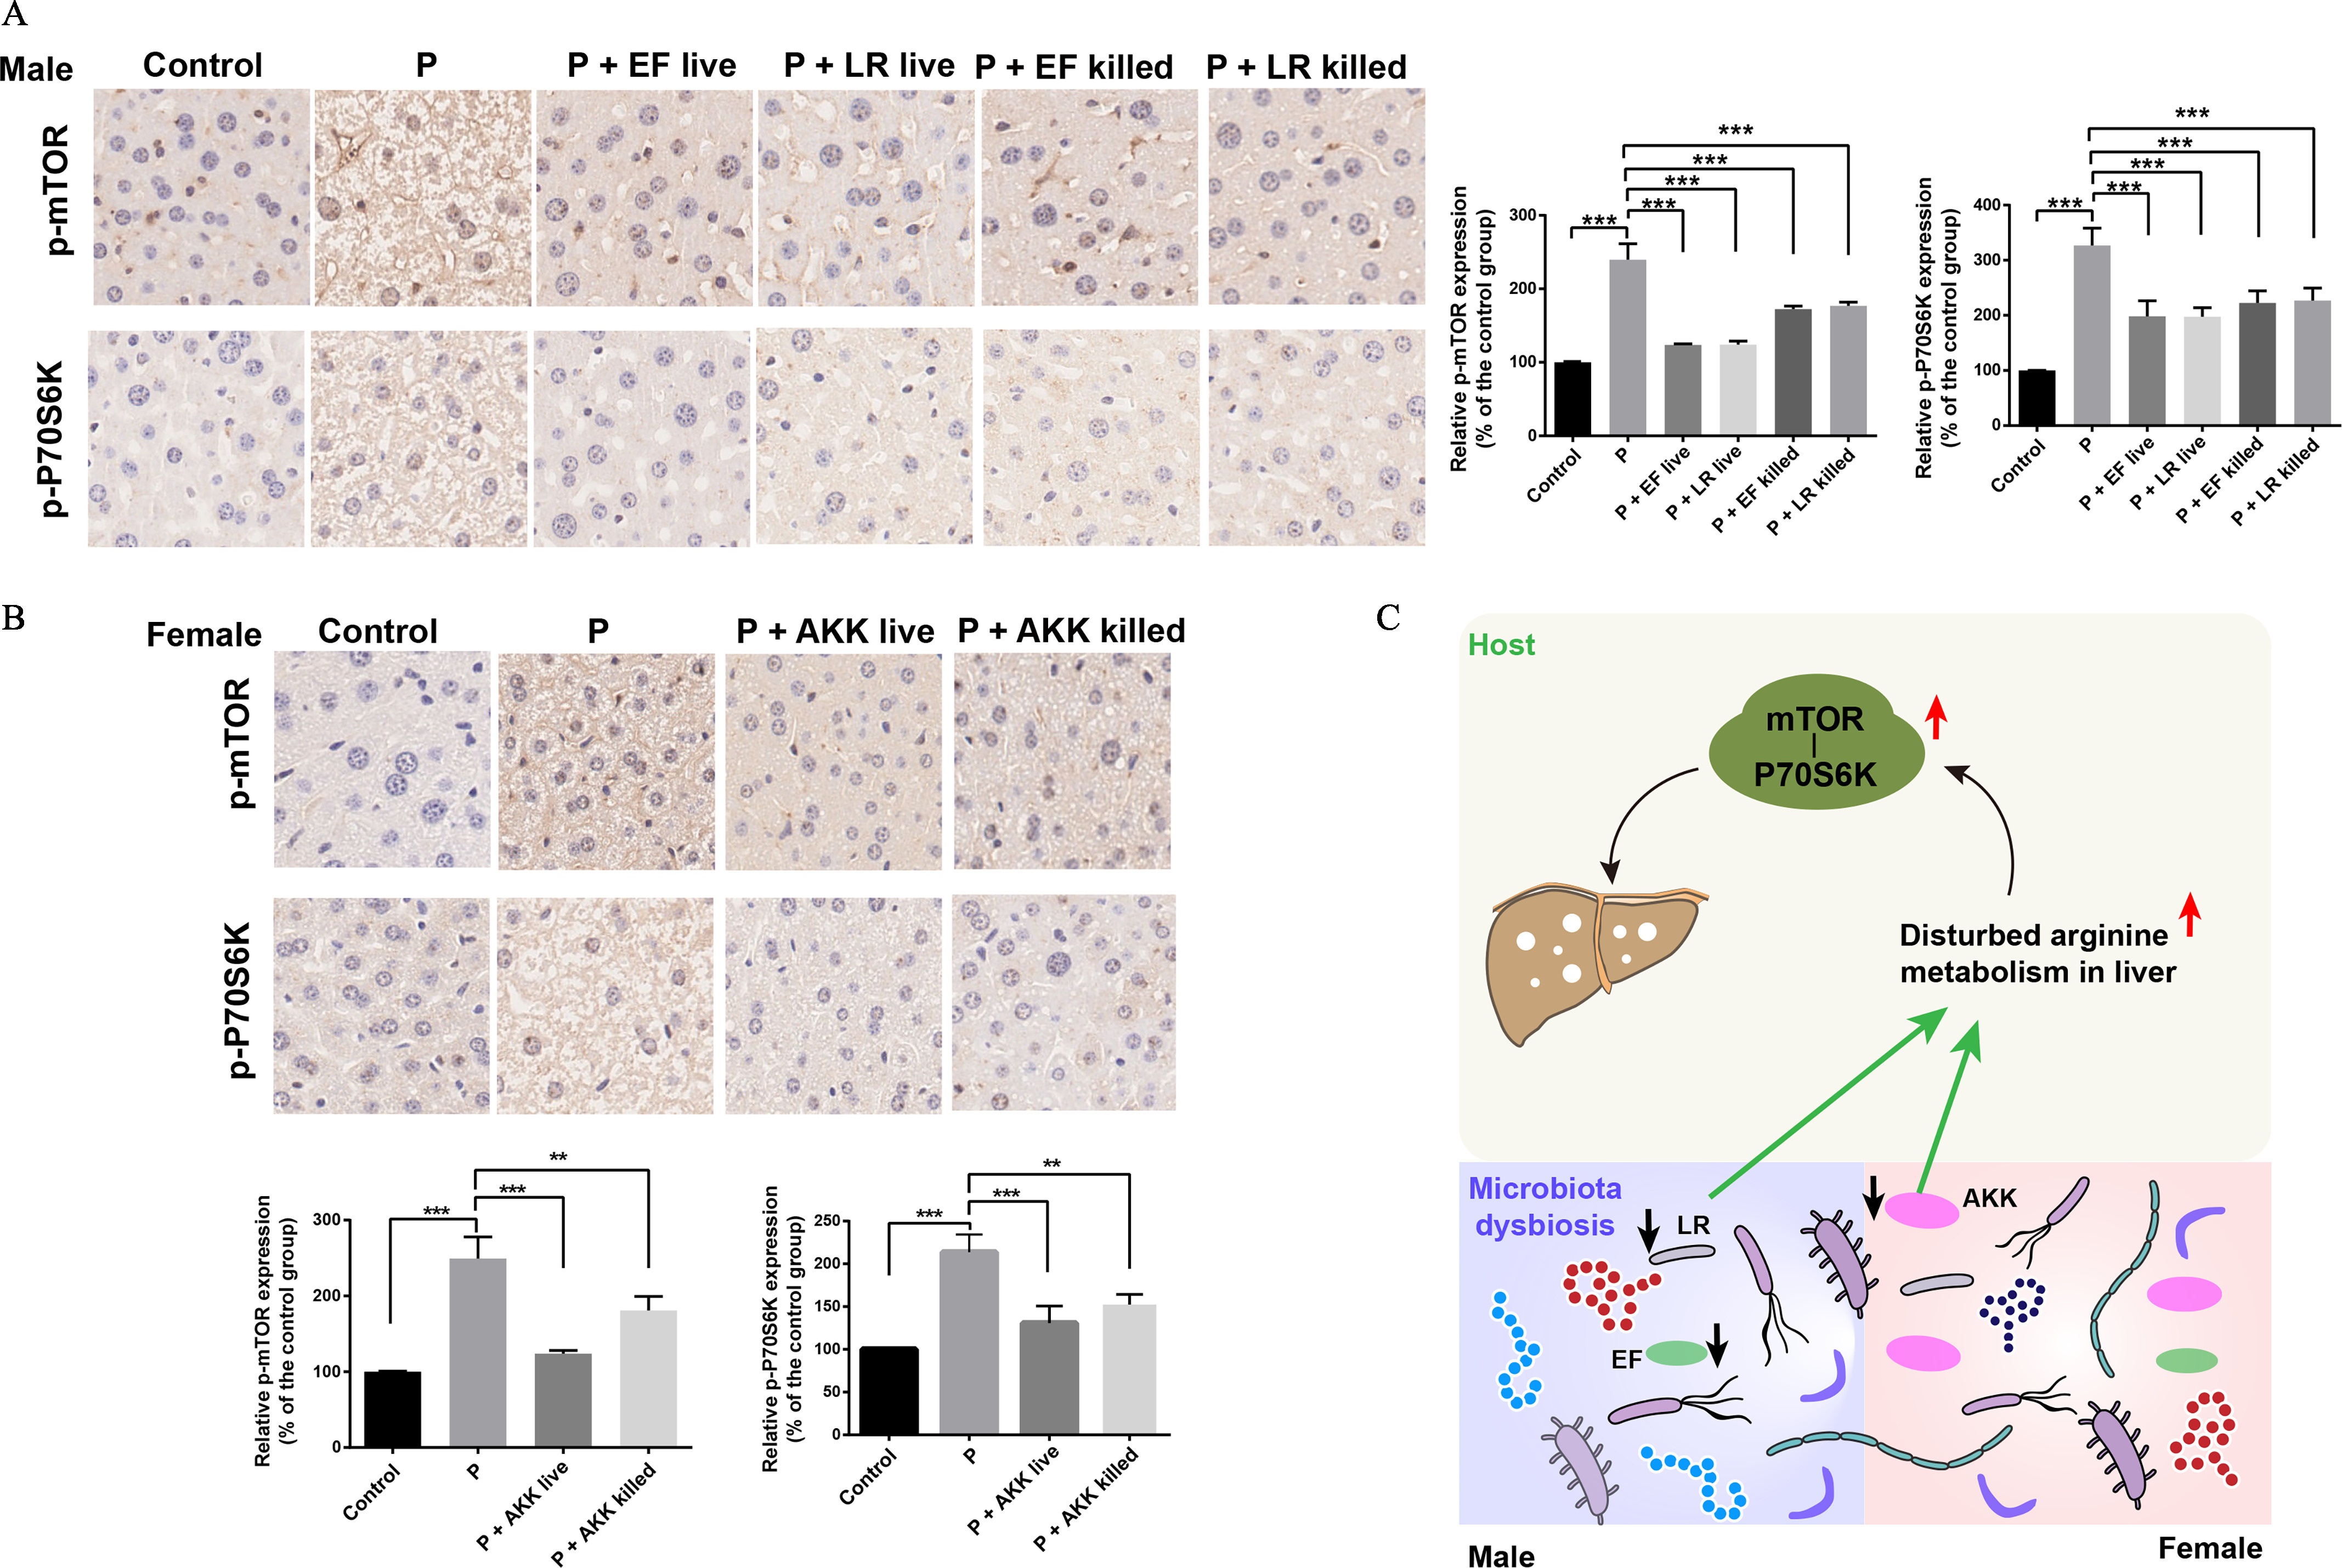
Figure 6A is a set of one stained tissue and two bar graphs. The stained tissue displays six columns, namely, control, uppercase p, uppercase p plus Enterococcus faecalis live, uppercase p plus Lactobacillus reuteri live, uppercase p plus Enterococcus faecalis killed, and uppercase p plus Lactobacillus reuteri killed and two rows under male, namely, lowercase p-Mammalian target of rapamycin and lowercase p- Ribosomal protein S6 kinase beta-1. The two bar graphs are plotting Relative lowercase p-Mammalian target of rapamycin expression (percentage of the control group), ranging from 0 to 300 in increments of 100 and Relative lowercase p- Ribosomal protein S6 kinase beta-1 (percentage of the control group), ranging from 0 to 400 in increments of 100 (y-axis) across control, uppercase p, uppercase p plus Enterococcus faecalis live, uppercase p plus Lactobacillus reuteri live, uppercase p plus Enterococcus faecalis killed, and uppercase p plus Lactobacillus reuteri killed (x-axis). Figure 6B is a set of one stained tissue and two bar graphs. The stained tissue displays four columns, namely, control, uppercase p, uppercase p plus Akkermansia muciniphila live, and uppercase p plus Akkermansia muciniphila killed and two rows under female, namely, lowercase p-Mammalian target of rapamycin and lowercase p- Ribosomal protein S6 kinase beta-1. The two bar graphs are plotting Relative lowercase p-Mammalian target of rapamycin expression (percentage of the control group), ranging from 0 to 300 in increments of 100 and Relative lowercase p- Ribosomal protein S6 kinase beta-1 (percentage of the control group), ranging from 0 to 250 in increments of 50 (y-axis) across control, uppercase p, uppercase p plus Akkermansia muciniphila live, and uppercase p plus Akkermansia muciniphila killed (x-axis). Figure 6C is a schematic diagram depicting the microbiota dysbiosis, including Lactobacillus reuteri and Akkermansia muciniphila in male and female mice, which leads to distributed arginine metabolism in the liver. The distributed arginine metabolism in the liver leads to lowercase p-Mammalian target of rapamycin and lowercase p-ribosomal protein S6 kinase beta-1 in the liver.

The effects of PFOS on the expressions of mTOR and P70S6K. (A) Expression of phosphorylated mTOR and P70S6K in fixed liver tissues of male mice in the indicated groups. (B) Expression of phosphorylated mTOR and P70S6K in fixed liver tissues of female mice in the indicated groups. (C) Schematic diagram of a potential mechanism by which the fecal microbiota contributes to PFOS-induced liver injury. PFOS regulates the abundances of fecal microbiota, which in turn contribute to the regulation of arginine levels in livers and then result in the activation of mTOR-P70S6K signaling pathway that can cause liver injury. n=3, The relative intensity represents the ratio between the expression level of phosphorylated protein (p-mTOR and p-P70S6K) and the total protein expression level (mTOR and P70S6K). Summary data can be found in Table S7. Statistical significance was analyzed by one-way ANOVA. Results were presented as the mean±SD. Note: AKK, Akk. muciniphila; ANOVA, analysis of variance; EF, E. faecalis; LR, L. reuteri; mTOR, mammalian target of rapamycin; P and PFOS, perfluorooctane sulfonate; SD, standard deviation. *p<0.05. **p<0.01. ***p<0.001 in comparison with the indicated group.