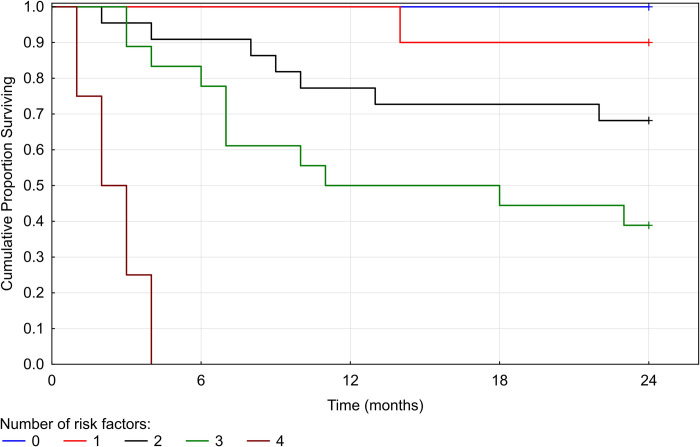
Fig 2. Relapse free interval—relation to the number of positive biomarkers.
Fig 2 shows five Kaplan-Meier curves that correspond to the number of positive biomarkers (0–4) defined by the multivariate analysis (i.e. age at clinical onset, EDSS at time of therapy initiation, IL2:IL6 CSF, IL-2 CSF, CHI3L2 CSF). RFI becomes shorter with every added positive biomarker. In our cohort, none of the patients tested positive for all five biomarkers.

