Fig. 12.

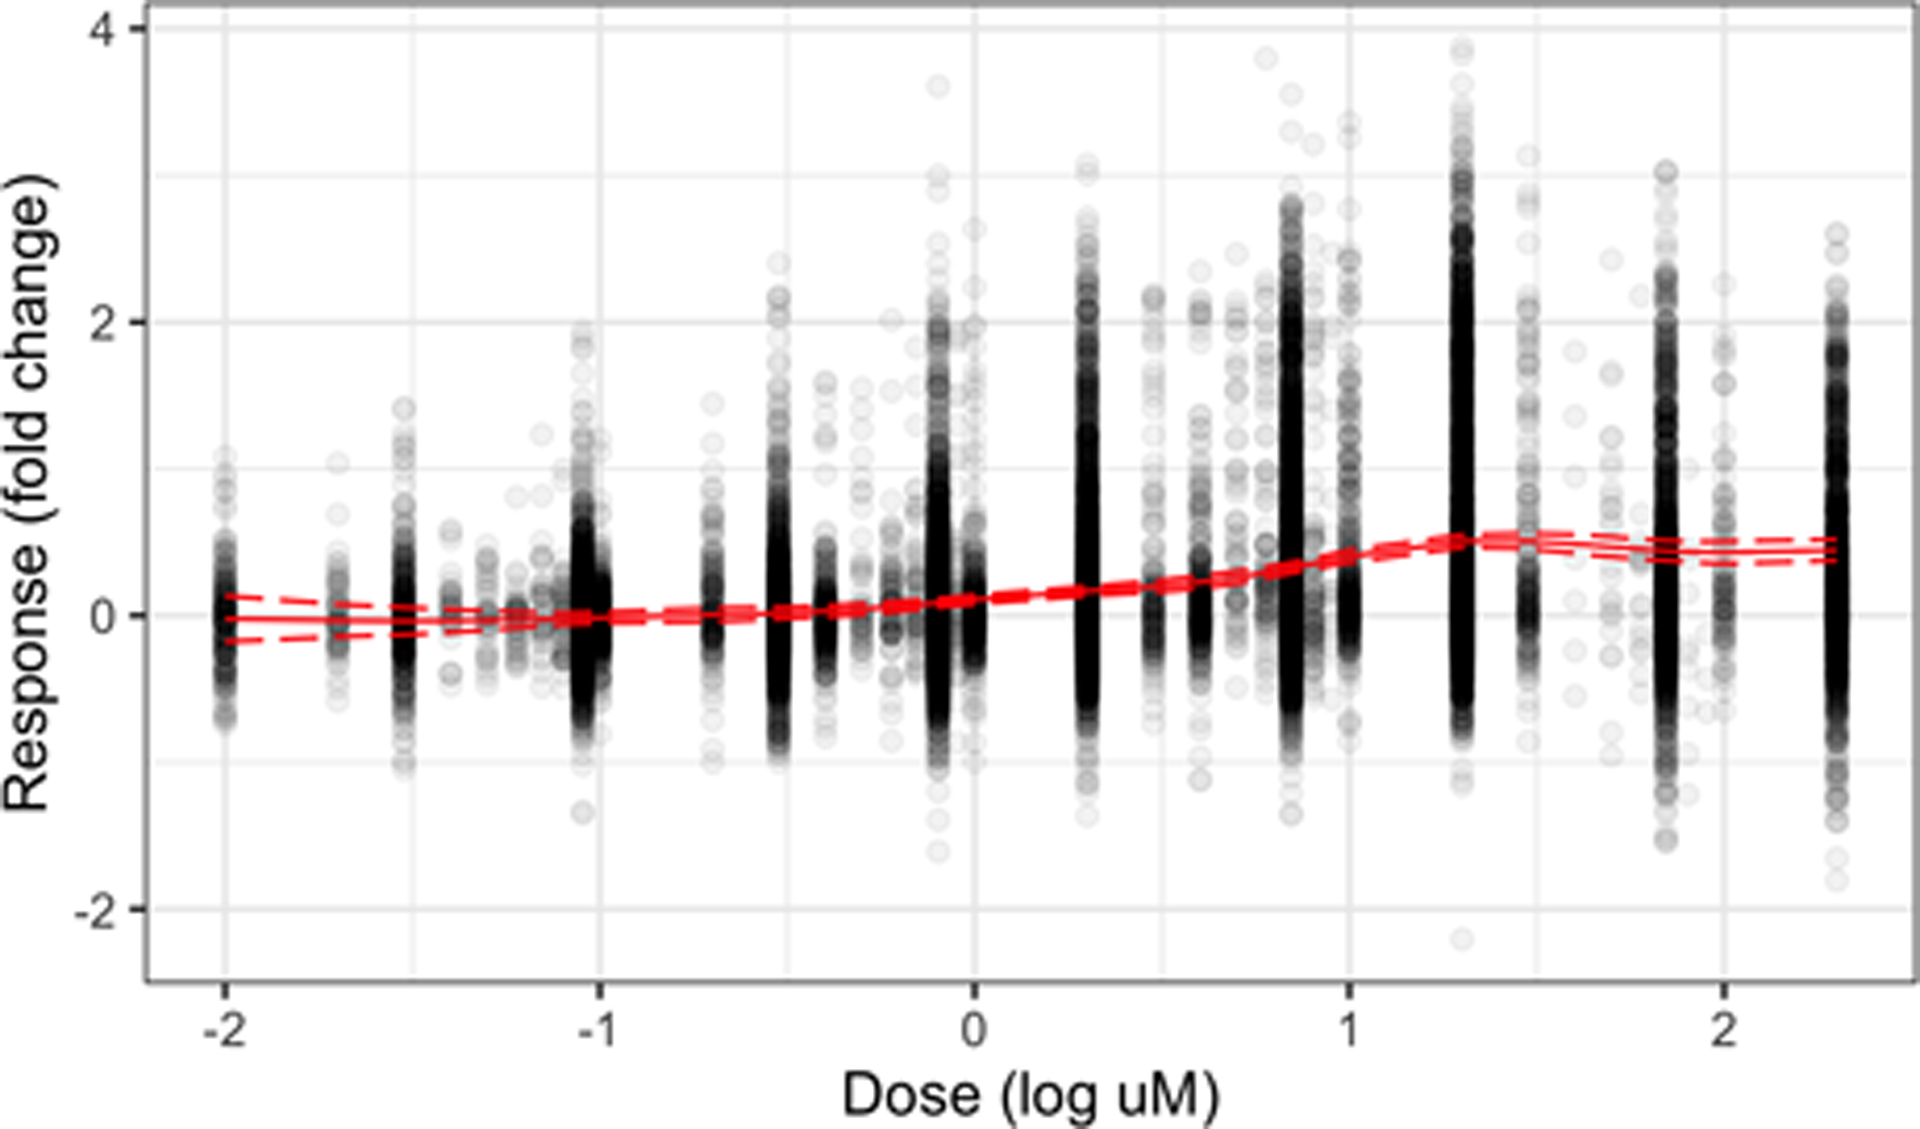
All response values at each dose in the data set. The solid line shows the model-predicted global mean μy and the dashed lines show the model-predicted 95% simultaneous credible band about μy.

All response values at each dose in the data set. The solid line shows the model-predicted global mean μy and the dashed lines show the model-predicted 95% simultaneous credible band about μy.