
Fig. 19.
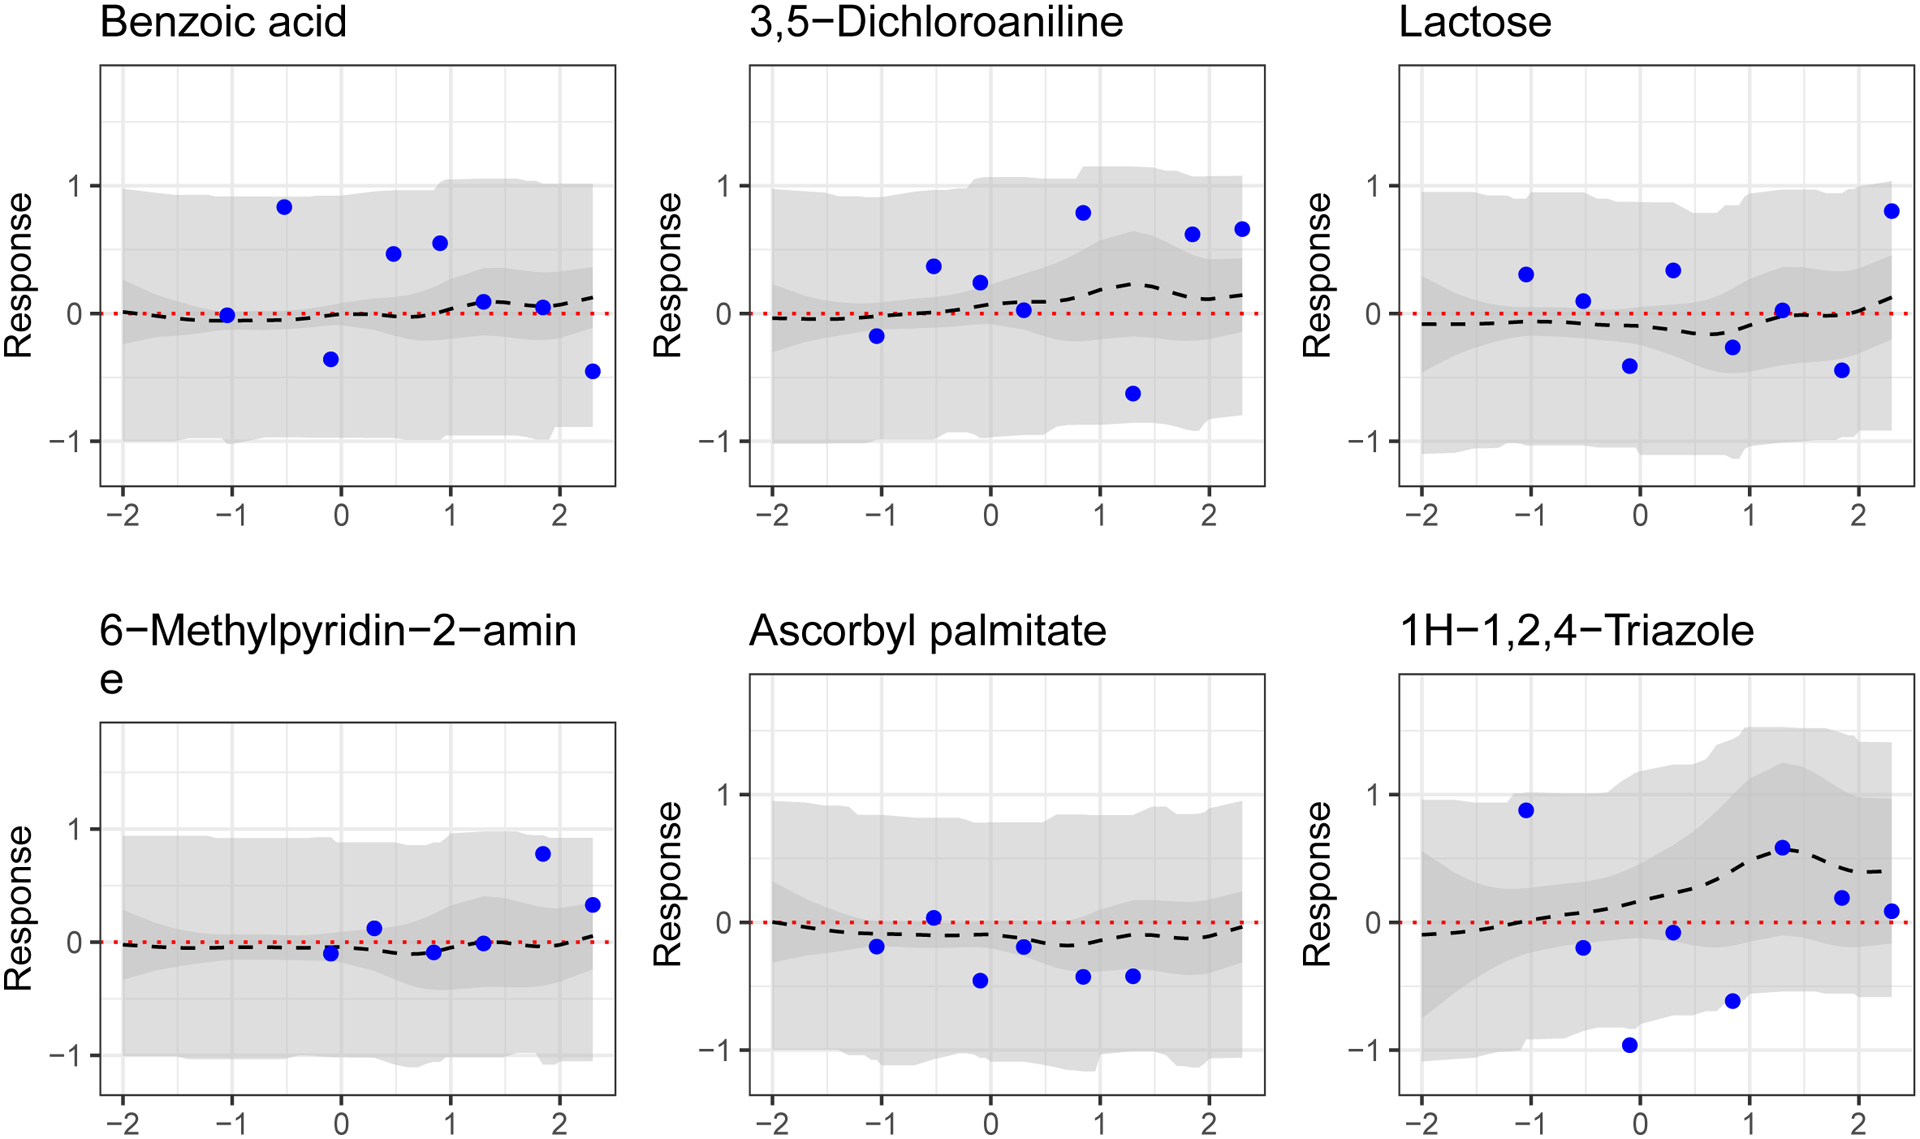
Results for select hold-out chemicals predicted by the model to be inactive. MSEs from left to right, top to bottom, are 0.22, 0.23, 0.14, 0.13, 0.06 and 0.42. Shown are predicted average dose-response curve (dashed black line), 95% simultaneous band for expected dose-response curve (darker grey ribbon) and 95% simultaneous band for observed data (lighter grey ribbon). Data (held out in training) are solid points.