
Fig. 9.
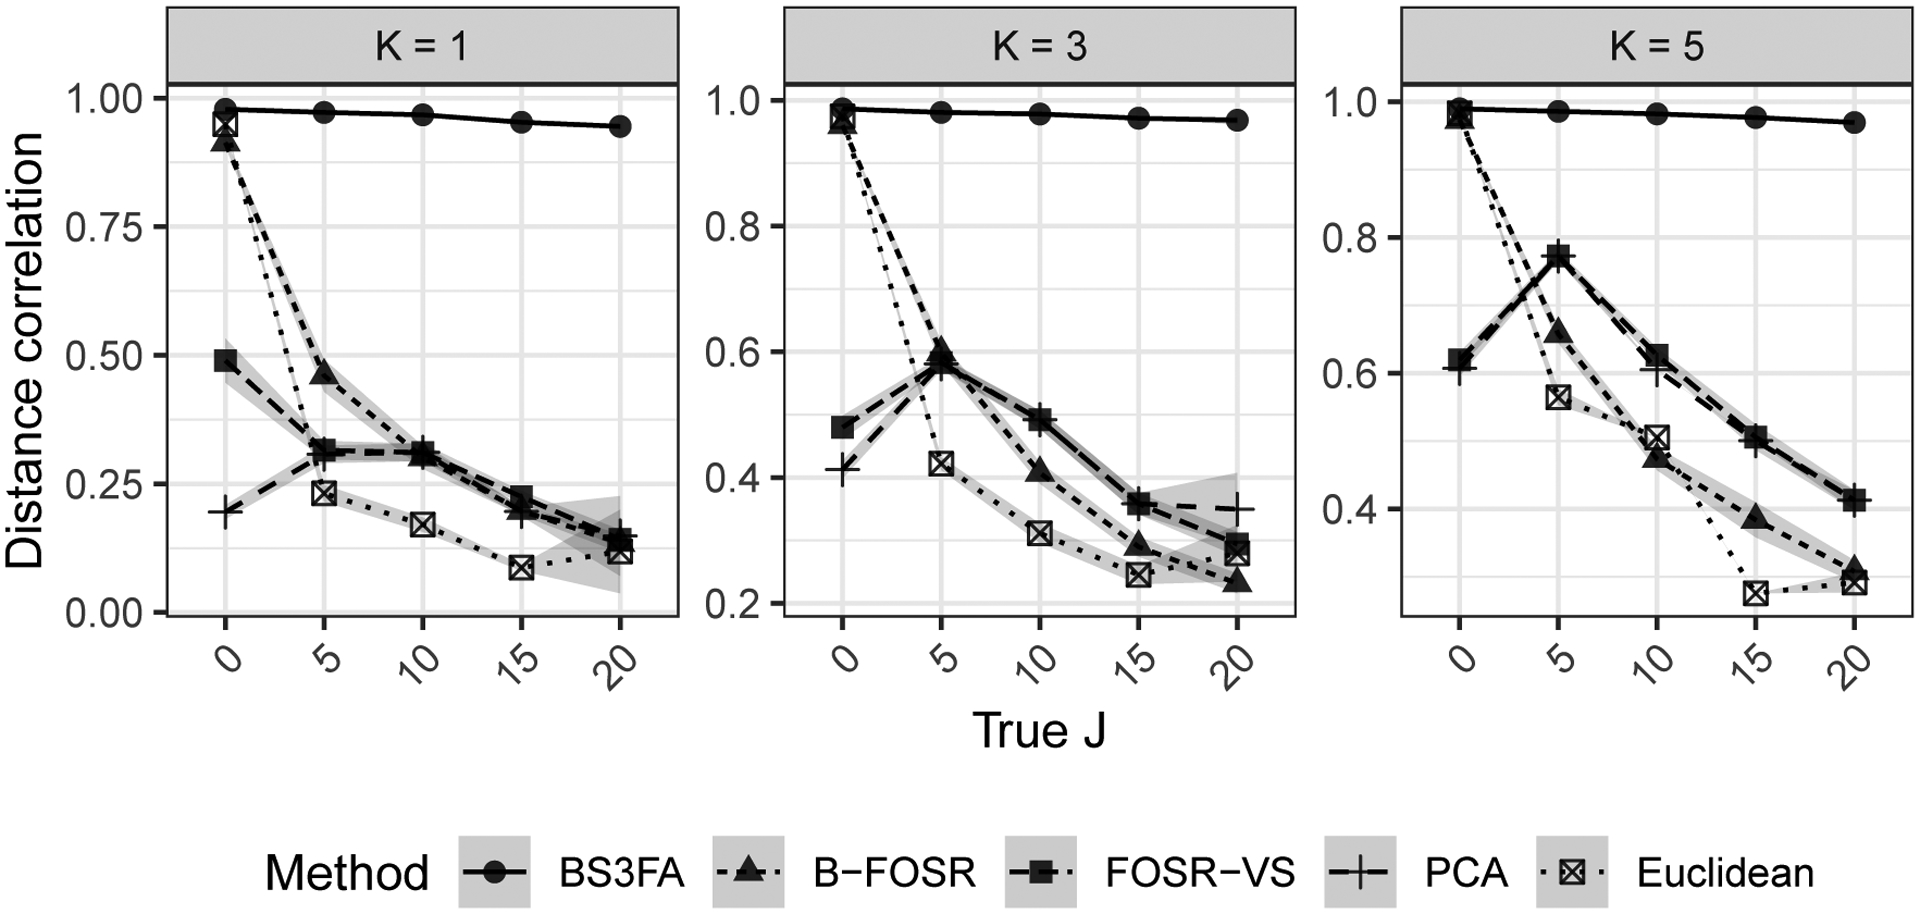
Correlation between entries in the true pairwise distance matrix (i.e., the Euclidean distance between true latent factors η) and the predicted pairwise distance matrix for holdout chemicals. Each subplot shows the result of 100 simulations per J across methods for a given true shared subspace dimension K.