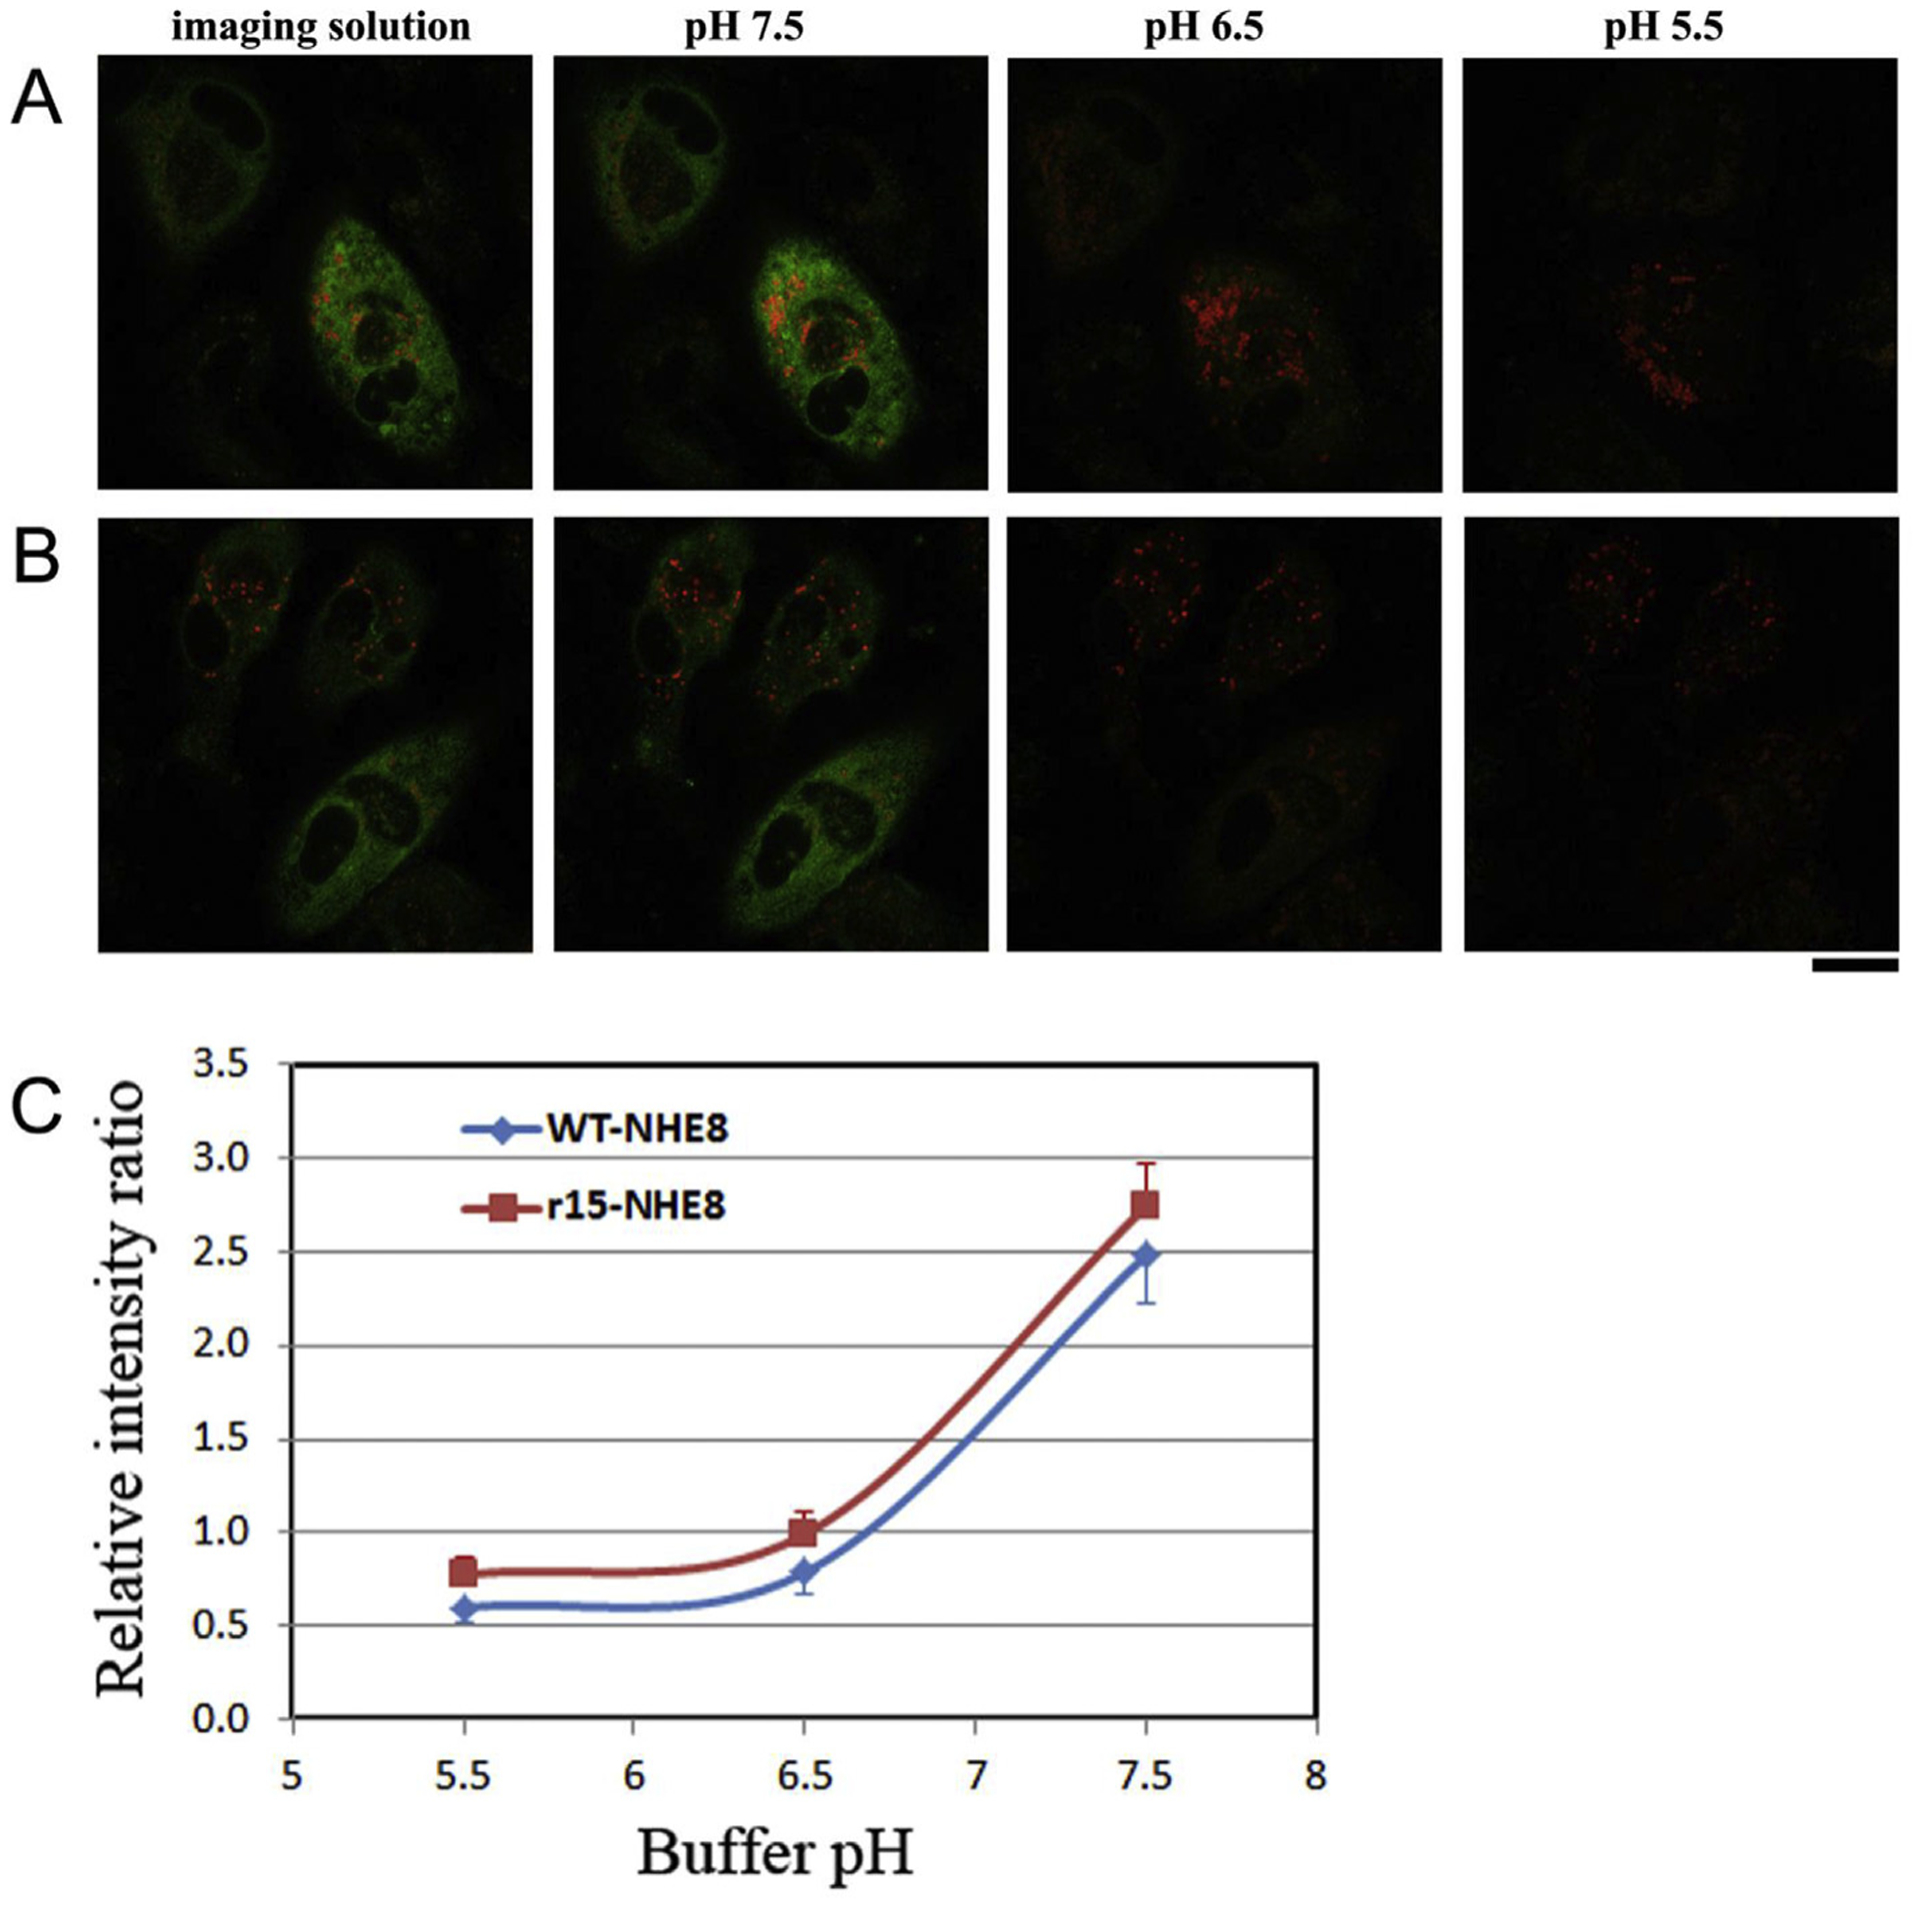
Fig. 6. Wild-type NHE8 and mutant r15(M120K)-NHE8 proteins displayed different pH response curves in cultured human RPE cells.

Cells were infected with AAV-wt-NHE8-mCherry-pHluorin and AAV-r15-NHE8-mCherry-pHluorin, respectively. (A) and (B) The cells were imaged in imaging buffer (pH 7.4) first, then subsequently in a series of gradually decreased pH buffers containing nigericin. pHluorin signals are pH sensitive, displaying diminished intensity as the pH decreases (from pH 7.5 to pH 5.5); while the mCherry signals are not sensitive to pH changes, showing relatively stable intensity as the pH drops, although the signals might become weaker due to photo bleaching. (A) The panels show wt-NHE8 AAV infected cells, and (B) the panels are mutant r15-NHE8 AAV infected cells. Scale bar: 20 μm. (C) The r15 mutation affects NHE8 protein’s pH response in hRPE cells. Mutant r15-NHE8 AAV infected cells displayed pH-response curve parallel shifted to the left of wt-NHE8 curve. The fluorescent intensity ratio of pH-sensitive pHluorin and pH-insensitive mCherry was calculated in each cell in various pH buffers containing nigericin, and the ratio was plotted against the buffer pH to generate a pH titration curve. Average ratio values from several cells were calculated and standard errors were shown (n = 3 for wt-NHE8 group, and n = 4 for r15-NHE8 group).
